| Red | Green | Blue | |
| z | 17.64 | ||
| znorm | Inf | ||
| sky | -Inf | -Inf | -Inf |
| S/N | 19.8 | 31.5 | 28.8 |
| S/N(c) | 0.0 | 0.0 | 0.0 |
| SN(E/C) |


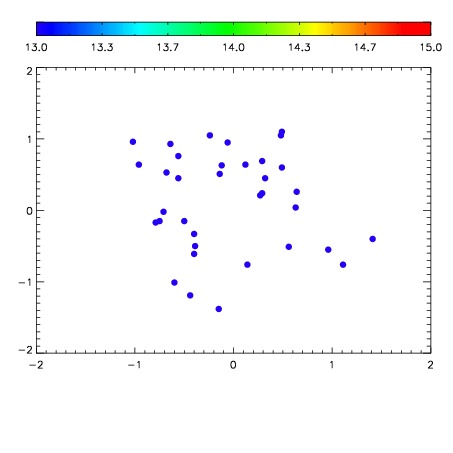

| Frame | Nreads | Zeropoints | Mag plots | Spatial mag deviation | Spatial sky 16325A emission deviations (filled: sky, open: star) | Spatial sky continuum emission | Spatial sky telluric CO2 absorption deviations (filled: H < 10) | |||||||||||||||||||||||
| 0 | 0 |
|
|
|
|
|
|
| IPAIR | NAME | SHIFT | NEWSHIFT | S/N | NAME | SHIFT | NEWSHIFT | S/N |
| 0 | 12660028 | 0.486725 | 0.00000 | 18.6006 | 12660029 | 0.000476514 | 0.486248 | 18.6984 |
| 1 | 12660027 | 0.485837 | 0.000887990 | 18.4571 | 12660022 | 0.00000 | 0.486725 | 18.5640 |
| 2 | 12660023 | 0.484526 | 0.00219899 | 18.2900 | 12660026 | -0.000479981 | 0.487205 | 18.3902 |
| 3 | 12660024 | 0.485411 | 0.00131401 | 18.2497 | 12660025 | -0.00162742 | 0.488352 | 18.3366 |