| Red | Green | Blue | |
| z | 17.64 | ||
| znorm | Inf | ||
| sky | -Inf | -Inf | -Inf |
| S/N | 12.1 | 20.8 | 21.5 |
| S/N(c) | 0.0 | 0.0 | 0.0 |
| SN(E/C) |
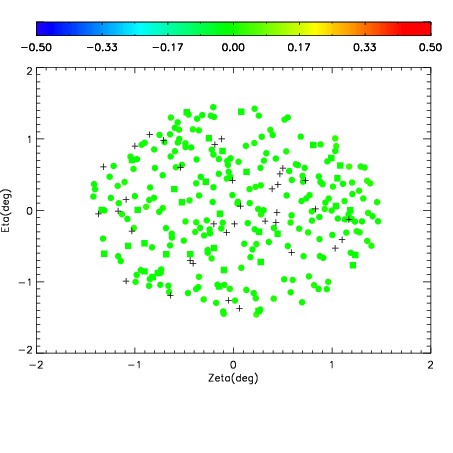
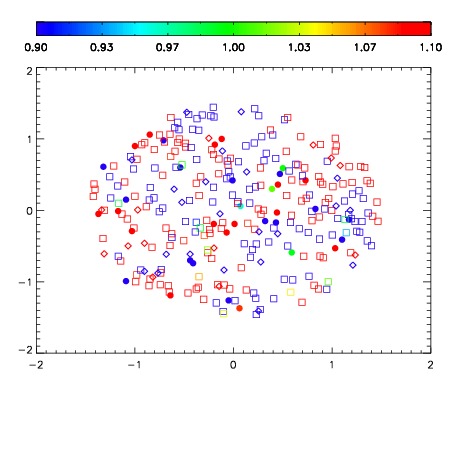
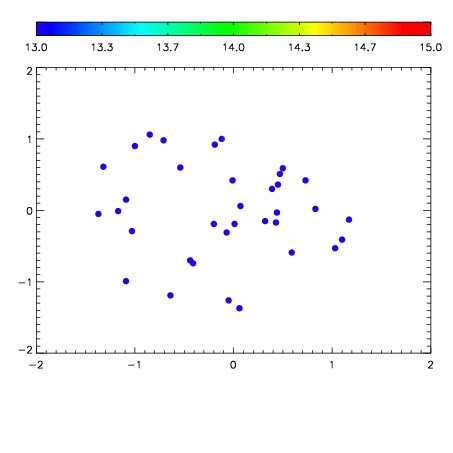

| Frame | Nreads | Zeropoints | Mag plots | Spatial mag deviation | Spatial sky 16325A emission deviations (filled: sky, open: star) | Spatial sky continuum emission | Spatial sky telluric CO2 absorption deviations (filled: H < 10) | |||||||||||||||||||||||
| 0 | 0 |
|
|
|
|
|
|
| IPAIR | NAME | SHIFT | NEWSHIFT | S/N | NAME | SHIFT | NEWSHIFT | S/N |
| 0 | 12620028 | 0.488004 | 0.00000 | 16.1717 | 12620026 | 0.00158215 | 0.486422 | 16.7206 |
| 1 | 12620024 | 0.487879 | 0.000124991 | 18.5942 | 12620025 | 0.000600572 | 0.487403 | 18.3328 |
| 2 | 12620023 | 0.486968 | 0.00103599 | 18.4711 | 12620022 | 0.00000 | 0.488004 | 18.1915 |
| 3 | 12620027 | 0.487079 | 0.000925004 | 17.3586 | 12620029 | -0.000236621 | 0.488241 | 17.4834 |