| Red | Green | Blue | |
| z | 17.64 | ||
| znorm | Inf | ||
| sky | -Inf | -Inf | -Inf |
| S/N | 15.0 | 28.1 | 27.8 |
| S/N(c) | 0.0 | 0.0 | 0.0 |
| SN(E/C) |
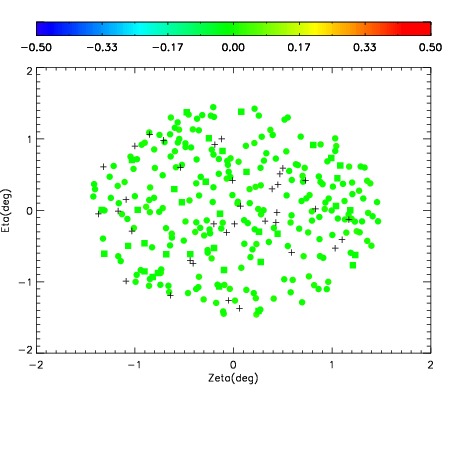


| Frame | Nreads | Zeropoints | Mag plots | Spatial mag deviation | Spatial sky 16325A emission deviations (filled: sky, open: star) | Spatial sky continuum emission | Spatial sky telluric CO2 absorption deviations (filled: H < 10) | |||||||||||||||||||||||
| 0 | 0 |
|
|
|
|
|
|
| IPAIR | NAME | SHIFT | NEWSHIFT | S/N | NAME | SHIFT | NEWSHIFT | S/N |
| 0 | 12720036 | 0.489472 | 0.00000 | 18.2075 | 12720034 | 0.00000 | 0.489472 | 18.0772 |
| 1 | 12720040 | 0.488701 | 0.000771016 | 18.3256 | 12720041 | -0.000639781 | 0.490112 | 18.4248 |
| 2 | 12720039 | 0.488325 | 0.00114700 | 18.3138 | 12720038 | -0.00189874 | 0.491371 | 18.2146 |
| 3 | 12720035 | 0.489028 | 0.000443995 | 18.1464 | 12720037 | -0.00186365 | 0.491336 | 18.0341 |