| Red | Green | Blue | |
| z | 17.64 | ||
| znorm | Inf | ||
| sky | -Inf | -Inf | -Inf |
| S/N | 24.3 | 41.0 | 42.6 |
| S/N(c) | 0.0 | 0.0 | 0.0 |
| SN(E/C) |

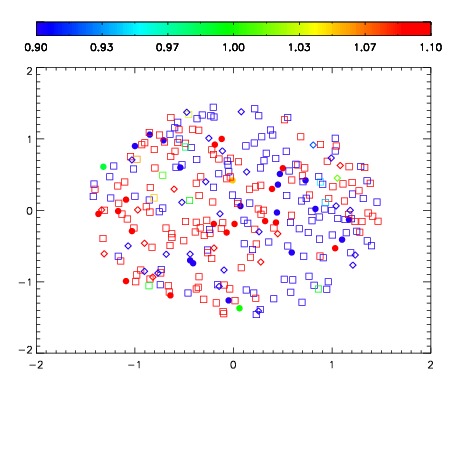


| Frame | Nreads | Zeropoints | Mag plots | Spatial mag deviation | Spatial sky 16325A emission deviations (filled: sky, open: star) | Spatial sky continuum emission | Spatial sky telluric CO2 absorption deviations (filled: H < 10) | |||||||||||||||||||||||
| 0 | 0 |
|
|
|
|
|
|
| IPAIR | NAME | SHIFT | NEWSHIFT | S/N | NAME | SHIFT | NEWSHIFT | S/N |
| 0 | 12740038 | 0.486366 | 0.00000 | 18.9531 | 12740039 | 0.00195036 | 0.484416 | 19.0004 |
| 1 | 12740037 | 0.485569 | 0.000797004 | 18.9302 | 12740035 | -0.000727916 | 0.487094 | 18.8823 |
| 2 | 12740033 | 0.483400 | 0.00296602 | 18.8394 | 12740036 | 0.000155728 | 0.486210 | 18.8454 |
| 3 | 12740034 | 0.484659 | 0.00170702 | 18.7746 | 12740032 | 0.00000 | 0.486366 | 18.7567 |