| Red | Green | Blue | |
| z | 17.64 | ||
| znorm | Inf | ||
| sky | -Inf | -Inf | -NaN |
| S/N | 10.6 | 20.0 | 19.9 |
| S/N(c) | 0.0 | 0.0 | 0.0 |
| SN(E/C) |
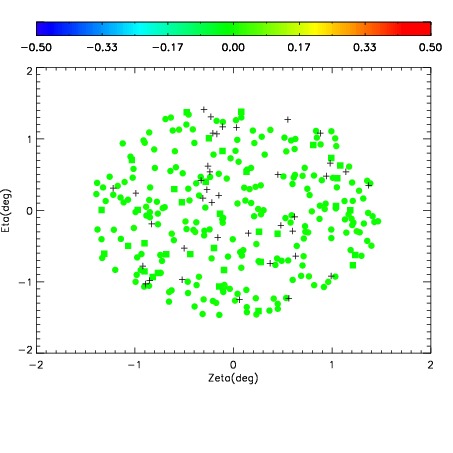
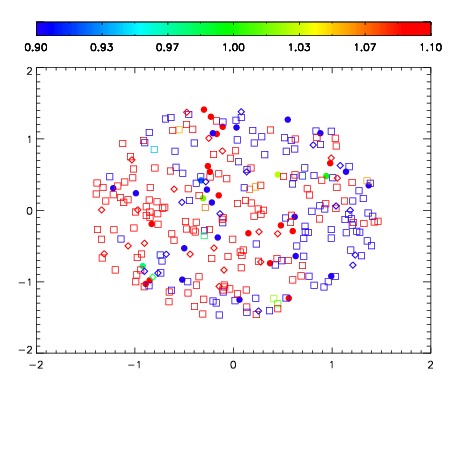


| Frame | Nreads | Zeropoints | Mag plots | Spatial mag deviation | Spatial sky 16325A emission deviations (filled: sky, open: star) | Spatial sky continuum emission | Spatial sky telluric CO2 absorption deviations (filled: H < 10) | |||||||||||||||||||||||
| 0 | 0 |
|
|
|
|
|
|
| IPAIR | NAME | SHIFT | NEWSHIFT | S/N | NAME | SHIFT | NEWSHIFT | S/N |
| 0 | 12290041 | 0.495271 | 0.00000 | 17.9409 | 12290039 | -0.00146485 | 0.496736 | 17.7583 |
| 1 | 12290037 | 0.494742 | 0.000528991 | 18.0885 | 12290042 | -0.000349546 | 0.495621 | 18.1945 |
| 2 | 12290036 | 0.494333 | 0.000937998 | 17.9677 | 12290035 | 0.00000 | 0.495271 | 17.7599 |
| 3 | 12290040 | 0.494844 | 0.000427008 | 17.9297 | 12290038 | -0.00176183 | 0.497033 | 17.6114 |