| Red | Green | Blue | |
| z | 17.64 | ||
| znorm | Inf | ||
| sky | -NaN | -Inf | -Inf |
| S/N | 24.8 | 38.1 | 38.7 |
| S/N(c) | 0.0 | 0.0 | 0.0 |
| SN(E/C) |
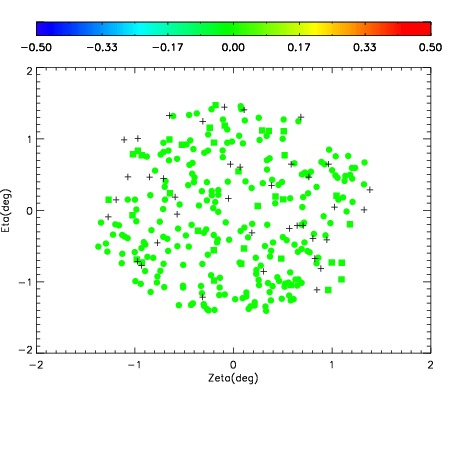
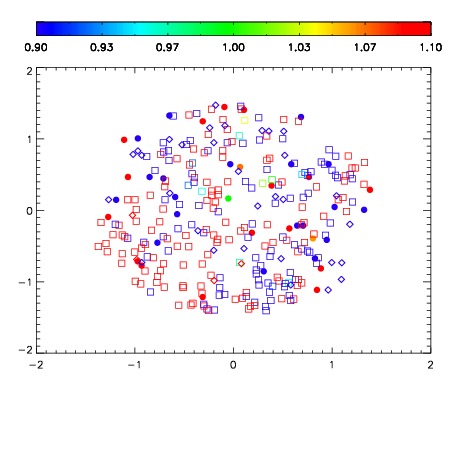
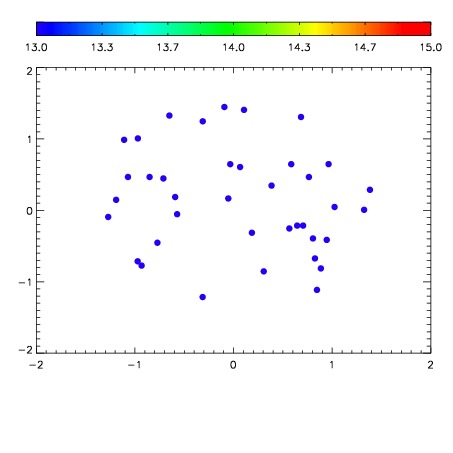

| Frame | Nreads | Zeropoints | Mag plots | Spatial mag deviation | Spatial sky 16325A emission deviations (filled: sky, open: star) | Spatial sky continuum emission | Spatial sky telluric CO2 absorption deviations (filled: H < 10) | |||||||||||||||||||||||
| 0 | 0 |
|
|
|
|
|
|
| IPAIR | NAME | SHIFT | NEWSHIFT | S/N | NAME | SHIFT | NEWSHIFT | S/N |
| 0 | 12060098 | 0.505693 | 0.00000 | 18.8787 | 12060099 | -0.00177067 | 0.507464 | 18.8450 |
| 1 | 12060097 | 0.505669 | 2.40207e-05 | 18.8585 | 12060096 | -0.00184282 | 0.507536 | 18.8155 |
| 2 | 12060093 | 0.503916 | 0.00177699 | 18.7106 | 12060095 | -0.00171323 | 0.507406 | 18.6996 |
| 3 | 12060094 | 0.504675 | 0.00101805 | 18.6816 | 12060092 | 0.00000 | 0.505693 | 18.6839 |