| Red | Green | Blue | |
| z | 17.64 | ||
| znorm | Inf | ||
| sky | -NaN | -Inf | -Inf |
| S/N | 24.2 | 37.2 | 37.3 |
| S/N(c) | 0.0 | 0.0 | 0.0 |
| SN(E/C) |
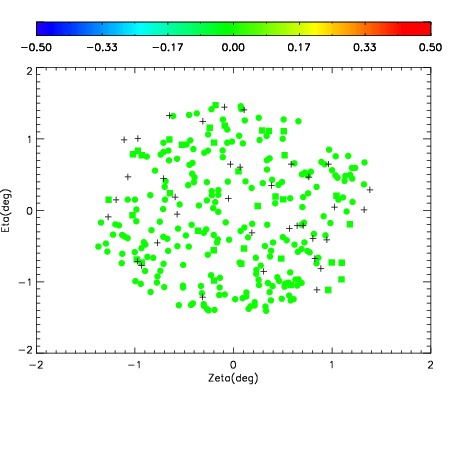
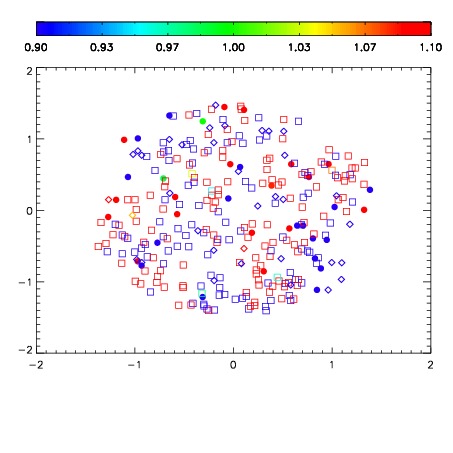
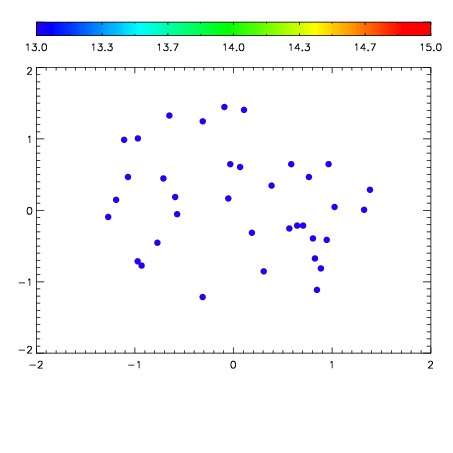

| Frame | Nreads | Zeropoints | Mag plots | Spatial mag deviation | Spatial sky 16325A emission deviations (filled: sky, open: star) | Spatial sky continuum emission | Spatial sky telluric CO2 absorption deviations (filled: H < 10) | |||||||||||||||||||||||
| 0 | 0 |
|
|
|
|
|
|
| IPAIR | NAME | SHIFT | NEWSHIFT | S/N | NAME | SHIFT | NEWSHIFT | S/N |
| 0 | 12320072 | 0.493161 | 0.00000 | 18.8912 | 12320073 | -0.00228738 | 0.495448 | 18.9089 |
| 1 | 12320071 | 0.493130 | 3.09944e-05 | 18.8621 | 12320070 | -0.00196589 | 0.495127 | 18.8319 |
| 2 | 12320067 | 0.492848 | 0.000312984 | 18.8127 | 12320066 | 0.00000 | 0.493161 | 18.8041 |
| 3 | 12320068 | 0.492902 | 0.000258982 | 18.1481 | 12320069 | -0.00195970 | 0.495121 | 18.7630 |