| Red | Green | Blue | |
| z | 17.64 | ||
| znorm | Inf | ||
| sky | -NaN | -NaN | -NaN |
| S/N | 25.8 | 39.4 | 39.5 |
| S/N(c) | 0.0 | 0.0 | 0.0 |
| SN(E/C) |
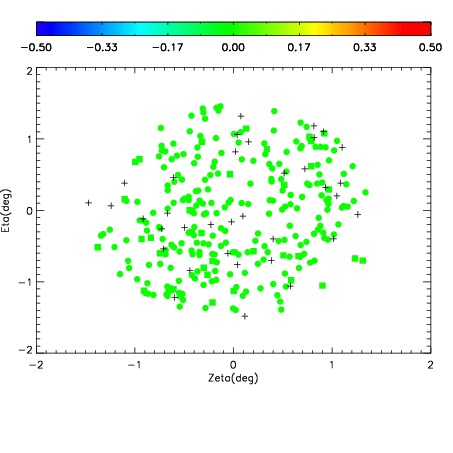
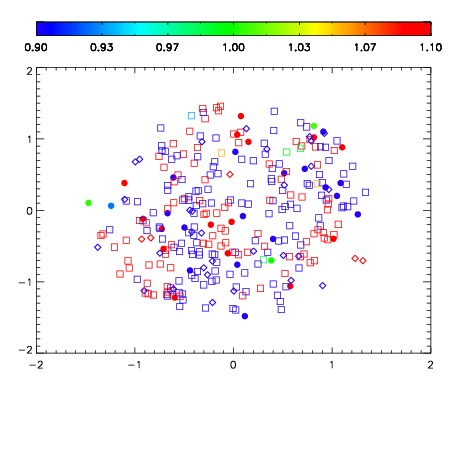
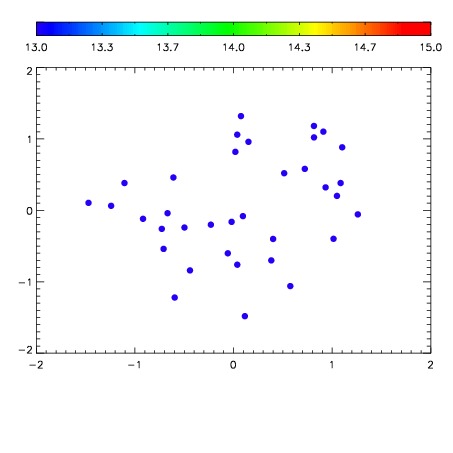

| Frame | Nreads | Zeropoints | Mag plots | Spatial mag deviation | Spatial sky 16325A emission deviations (filled: sky, open: star) | Spatial sky continuum emission | Spatial sky telluric CO2 absorption deviations (filled: H < 10) | |||||||||||||||||||||||
| 0 | 0 |
|
|
|
|
|
|
| IPAIR | NAME | SHIFT | NEWSHIFT | S/N | NAME | SHIFT | NEWSHIFT | S/N |
| 0 | 09040038 | 0.483758 | 0.00000 | 17.9242 | 09040037 | 0.00406489 | 0.479693 | 18.7923 |
| 1 | 09040035 | 0.481104 | 0.00265402 | 19.0423 | 09040036 | 0.00378279 | 0.479975 | 19.0351 |
| 2 | 09040034 | 0.479313 | 0.00444502 | 19.0395 | 09040033 | 0.00000 | 0.483758 | 19.0050 |
| 3 | 09040039 | 0.482528 | 0.00123000 | 18.7485 | 09040040 | 0.00485414 | 0.478904 | 18.7975 |