| Red | Green | Blue | |
| z | 17.64 | ||
| znorm | Inf | ||
| sky | -NaN | -NaN | -Inf |
| S/N | 28.8 | 46.3 | 46.2 |
| S/N(c) | 0.0 | 0.0 | 0.0 |
| SN(E/C) |
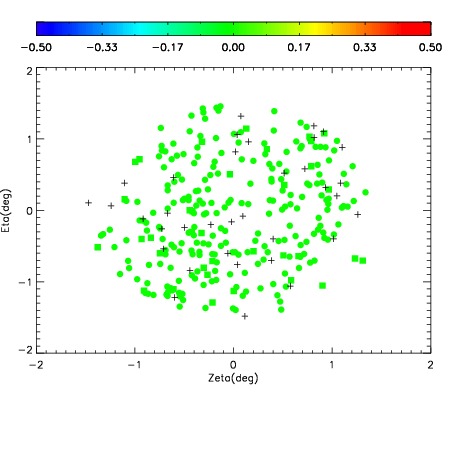
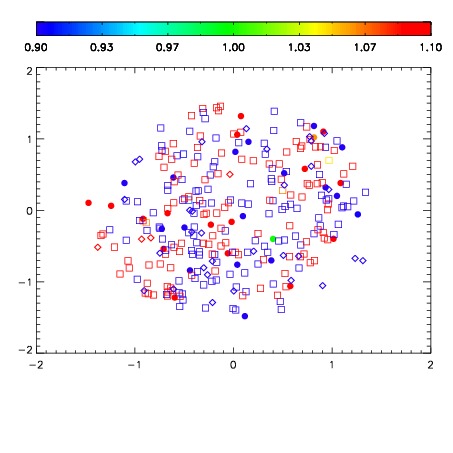
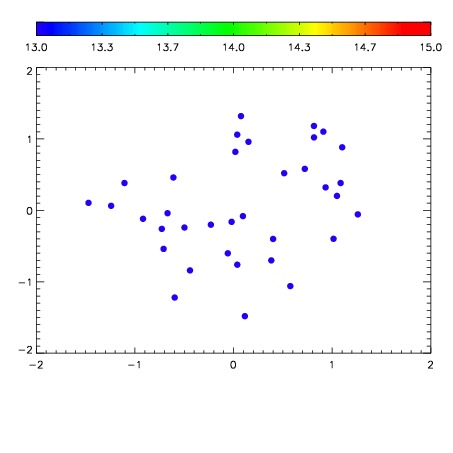

| Frame | Nreads | Zeropoints | Mag plots | Spatial mag deviation | Spatial sky 16325A emission deviations (filled: sky, open: star) | Spatial sky continuum emission | Spatial sky telluric CO2 absorption deviations (filled: H < 10) | |||||||||||||||||||||||
| 0 | 0 |
|
|
|
|
|
|
| IPAIR | NAME | SHIFT | NEWSHIFT | S/N | NAME | SHIFT | NEWSHIFT | S/N |
| 0 | 09080065 | 0.481300 | 0.00000 | 19.0871 | 09080066 | 0.00702098 | 0.474279 | 19.0572 |
| 1 | 09080064 | 0.481016 | 0.000283986 | 19.0490 | 09080063 | 0.00508121 | 0.476219 | 19.0456 |
| 2 | 09080061 | 0.480899 | 0.000400990 | 19.0399 | 09080062 | 0.00514374 | 0.476156 | 19.0430 |
| 3 | 09080060 | 0.480648 | 0.000651985 | 19.0236 | 09080059 | 0.00000 | 0.481300 | 19.0391 |