| Red | Green | Blue | |
| z | 17.64 | ||
| znorm | Inf | ||
| sky | -NaN | -Inf | -Inf |
| S/N | 24.7 | 39.4 | 38.3 |
| S/N(c) | 0.0 | 0.0 | 0.0 |
| SN(E/C) |
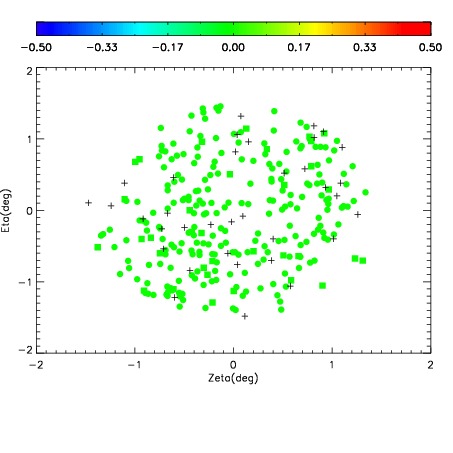
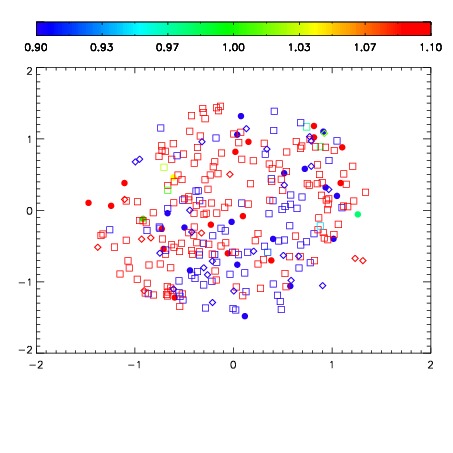
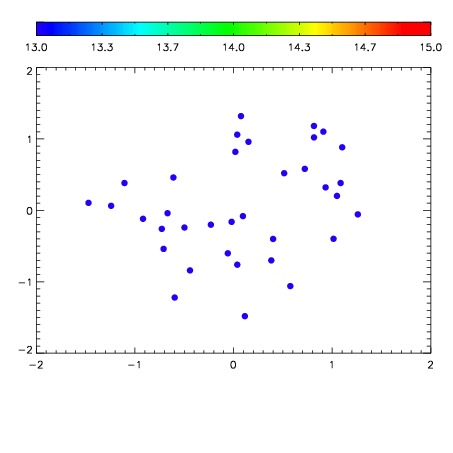

| Frame | Nreads | Zeropoints | Mag plots | Spatial mag deviation | Spatial sky 16325A emission deviations (filled: sky, open: star) | Spatial sky continuum emission | Spatial sky telluric CO2 absorption deviations (filled: H < 10) | |||||||||||||||||||||||
| 0 | 0 |
|
|
|
|
|
|
| IPAIR | NAME | SHIFT | NEWSHIFT | S/N | NAME | SHIFT | NEWSHIFT | S/N |
| 0 | 09780031 | 0.513549 | 0.00000 | 18.8411 | 09780032 | 0.00167004 | 0.511879 | 18.8682 |
| 1 | 09780030 | 0.513324 | 0.000224948 | 18.8356 | 09780028 | 0.00180553 | 0.511743 | 18.8187 |
| 2 | 09780027 | 0.513380 | 0.000168979 | 18.7623 | 09780029 | 0.00180587 | 0.511743 | 18.8142 |
| 3 | 09780026 | 0.512682 | 0.000866950 | 18.7534 | 09780025 | 0.00000 | 0.513549 | 18.5449 |