| Red | Green | Blue | |
| z | 17.64 | ||
| znorm | Inf | ||
| sky | -Inf | -Inf | -Inf |
| S/N | 26.8 | 43.1 | 45.7 |
| S/N(c) | 0.0 | 0.0 | 0.0 |
| SN(E/C) |
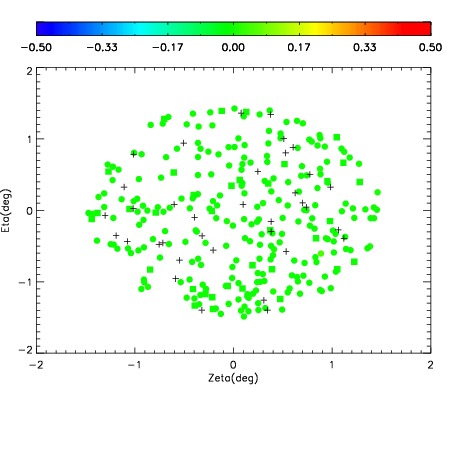
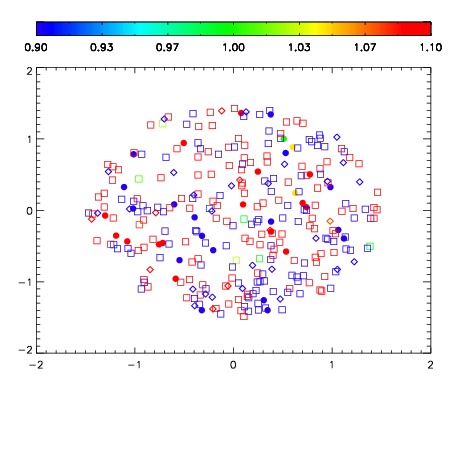


| Frame | Nreads | Zeropoints | Mag plots | Spatial mag deviation | Spatial sky 16325A emission deviations (filled: sky, open: star) | Spatial sky continuum emission | Spatial sky telluric CO2 absorption deviations (filled: H < 10) | |||||||||||||||||||||||
| 0 | 0 |
|
|
|
|
|
|
| IPAIR | NAME | SHIFT | NEWSHIFT | S/N | NAME | SHIFT | NEWSHIFT | S/N |
| 0 | 10080012 | 0.472533 | 0.00000 | 18.9935 | 10080014 | 0.00276503 | 0.469768 | 18.9904 |
| 1 | 10080015 | 0.472357 | 0.000175983 | 19.0044 | 10080017 | 0.000417284 | 0.472116 | 19.0741 |
| 2 | 10080011 | 0.472438 | 9.49800e-05 | 18.9778 | 10080013 | 0.00255597 | 0.469977 | 18.9571 |
| 3 | 10080016 | 0.471996 | 0.000536978 | 18.9621 | 10080010 | 0.00000 | 0.472533 | 18.9270 |