| Red | Green | Blue | |
| z | 17.64 | ||
| znorm | Inf | ||
| sky | -Inf | -Inf | -Inf |
| S/N | 30.1 | 46.5 | 49.3 |
| S/N(c) | 0.0 | 0.0 | 0.0 |
| SN(E/C) |
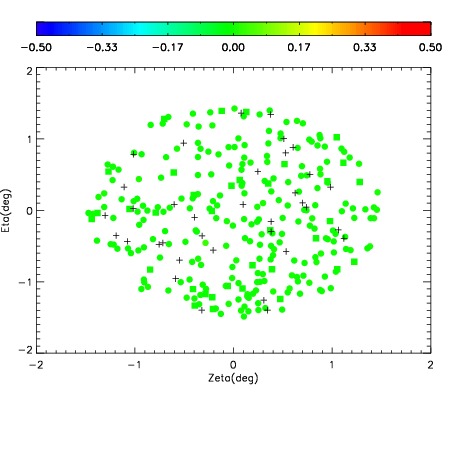
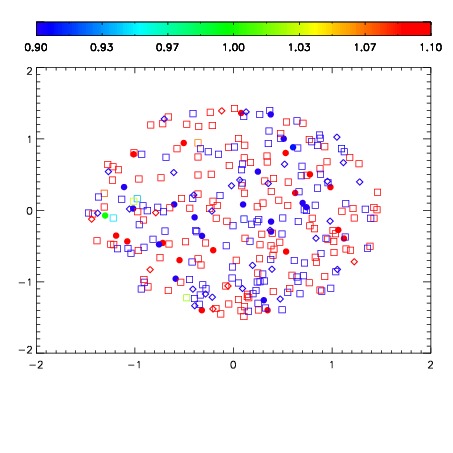


| Frame | Nreads | Zeropoints | Mag plots | Spatial mag deviation | Spatial sky 16325A emission deviations (filled: sky, open: star) | Spatial sky continuum emission | Spatial sky telluric CO2 absorption deviations (filled: H < 10) | |||||||||||||||||||||||
| 0 | 0 |
|
|
|
|
|
|
| IPAIR | NAME | SHIFT | NEWSHIFT | S/N | NAME | SHIFT | NEWSHIFT | S/N |
| 0 | 10120016 | 0.495406 | 0.00000 | 19.0877 | 10120014 | 0.00166130 | 0.493745 | 18.9966 |
| 1 | 10120012 | 0.494321 | 0.00108501 | 19.1260 | 10120010 | 0.00000 | 0.495406 | 19.1062 |
| 2 | 10120011 | 0.494604 | 0.000802010 | 19.1189 | 10120017 | 0.000658700 | 0.494747 | 19.0671 |
| 3 | 10120015 | 0.494512 | 0.000894010 | 19.0995 | 10120013 | 0.00125958 | 0.494146 | 19.0351 |