| Red | Green | Blue | |
| z | 17.64 | ||
| znorm | Inf | ||
| sky | -Inf | -Inf | -NaN |
| S/N | 20.0 | 31.7 | 32.7 |
| S/N(c) | 0.0 | 0.0 | 0.0 |
| SN(E/C) |
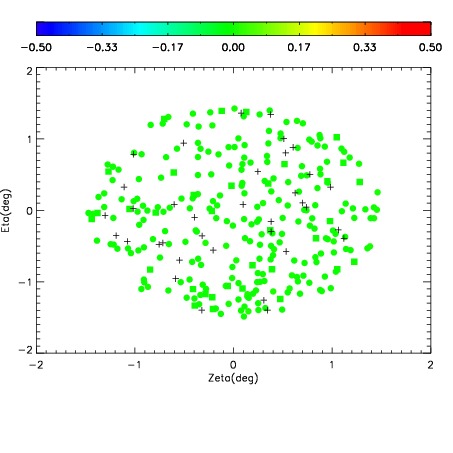
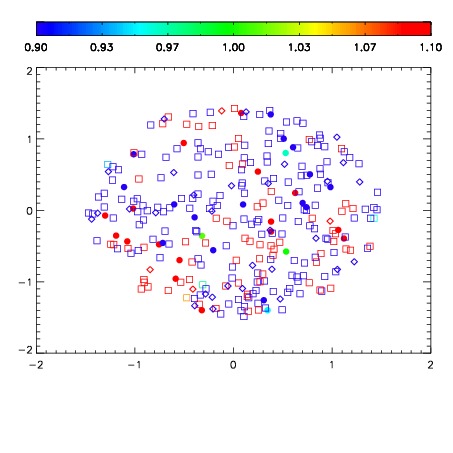


| Frame | Nreads | Zeropoints | Mag plots | Spatial mag deviation | Spatial sky 16325A emission deviations (filled: sky, open: star) | Spatial sky continuum emission | Spatial sky telluric CO2 absorption deviations (filled: H < 10) | |||||||||||||||||||||||
| 0 | 0 |
|
|
|
|
|
|
| IPAIR | NAME | SHIFT | NEWSHIFT | S/N | NAME | SHIFT | NEWSHIFT | S/N |
| 0 | 12460028 | 0.495105 | 0.00000 | 18.1429 | 12460027 | 0.00000 | 0.495105 | 18.4835 |
| 1 | 12460032 | 0.491177 | 0.00392801 | 18.9238 | 12460030 | -0.00102520 | 0.496130 | 18.9208 |
| 2 | 12460029 | 0.494214 | 0.000891000 | 18.7640 | 12460031 | -0.000575743 | 0.495681 | 18.6789 |