| Red | Green | Blue | |
| z | 17.64 | ||
| znorm | Inf | ||
| sky | -NaN | -NaN | -Inf |
| S/N | 28.6 | 45.8 | 50.0 |
| S/N(c) | 0.0 | 0.0 | 0.0 |
| SN(E/C) |
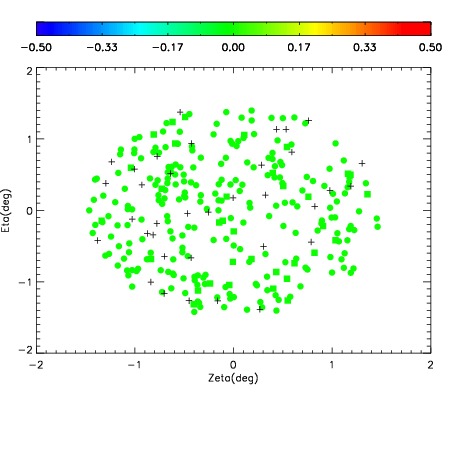
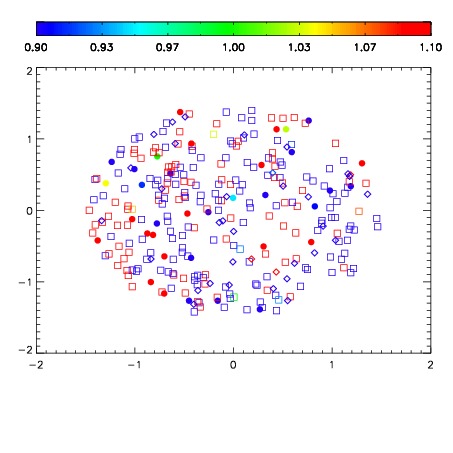
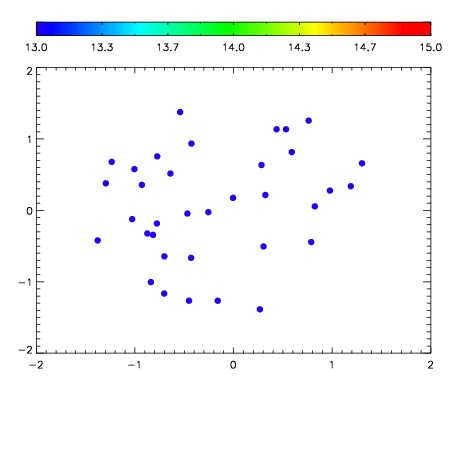

| Frame | Nreads | Zeropoints | Mag plots | Spatial mag deviation | Spatial sky 16325A emission deviations (filled: sky, open: star) | Spatial sky continuum emission | Spatial sky telluric CO2 absorption deviations (filled: H < 10) | |||||||||||||||||||||||
| 0 | 0 |
|
|
|
|
|
|
| IPAIR | NAME | SHIFT | NEWSHIFT | S/N | NAME | SHIFT | NEWSHIFT | S/N |
| 0 | 10050012 | 0.473529 | 0.00000 | 19.1001 | 10050018 | -0.00109429 | 0.474623 | 19.1646 |
| 1 | 10050016 | 0.472701 | 0.000827998 | 19.0881 | 10050011 | 0.00000 | 0.473529 | 19.0833 |
| 2 | 10050017 | 0.473081 | 0.000448018 | 19.0874 | 10050015 | 0.000922554 | 0.472606 | 19.0180 |
| 3 | 10050013 | 0.473043 | 0.000486016 | 19.0713 | 10050014 | 0.00103413 | 0.472495 | 18.9998 |