| Red | Green | Blue | |
| z | 17.64 | ||
| znorm | Inf | ||
| sky | -NaN | -NaN | -Inf |
| S/N | 22.5 | 39.3 | 39.9 |
| S/N(c) | 0.0 | 0.0 | 0.0 |
| SN(E/C) |
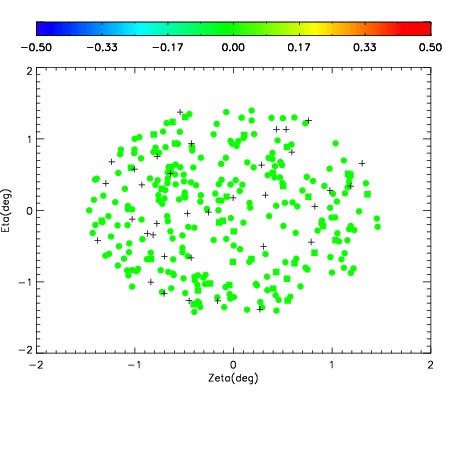
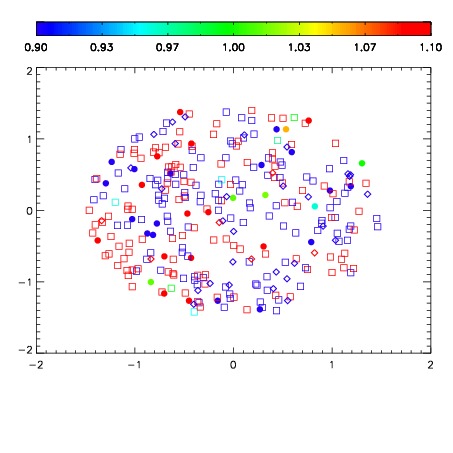
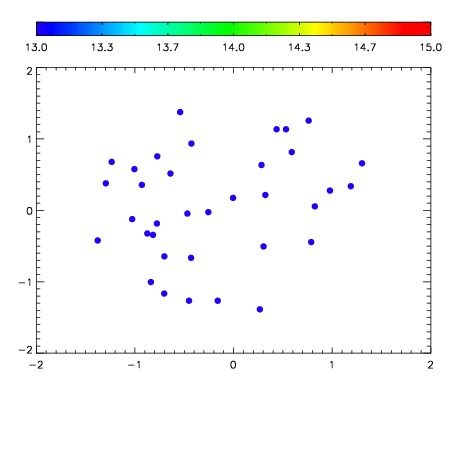

| Frame | Nreads | Zeropoints | Mag plots | Spatial mag deviation | Spatial sky 16325A emission deviations (filled: sky, open: star) | Spatial sky continuum emission | Spatial sky telluric CO2 absorption deviations (filled: H < 10) | |||||||||||||||||||||||
| 0 | 0 |
|
|
|
|
|
|
| IPAIR | NAME | SHIFT | NEWSHIFT | S/N | NAME | SHIFT | NEWSHIFT | S/N |
| 0 | 10090018 | 0.473863 | 0.00000 | 18.6818 | 10090016 | 0.00173462 | 0.472128 | 18.7447 |
| 1 | 10090017 | 0.472944 | 0.000919014 | 18.7912 | 10090012 | 0.00000 | 0.473863 | 18.8664 |
| 2 | 10090013 | 0.470619 | 0.00324401 | 18.7253 | 10090015 | 0.00110120 | 0.472762 | 18.8087 |
| 3 | 10090014 | 0.472172 | 0.00169101 | 18.6520 | 10090019 | 0.00416180 | 0.469701 | 18.4949 |