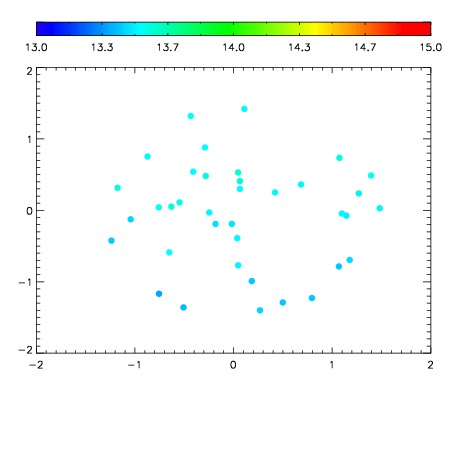
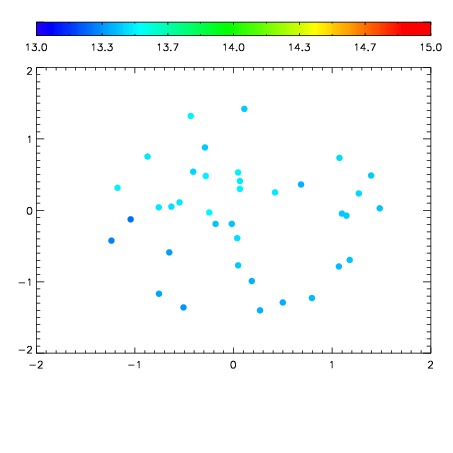
| Frame | Nreads | Zeropoints | Mag plots
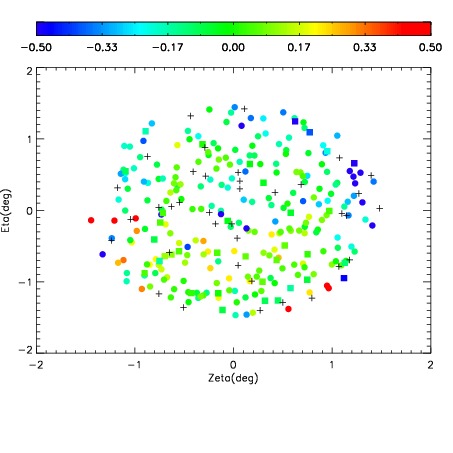
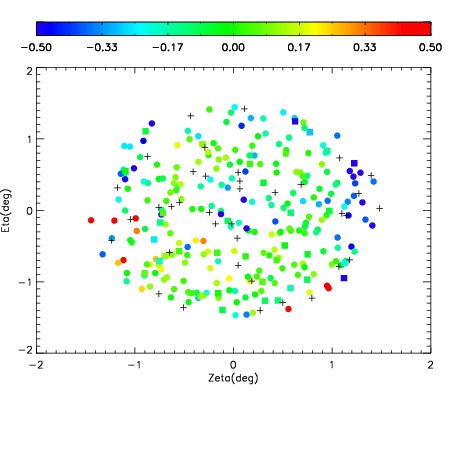
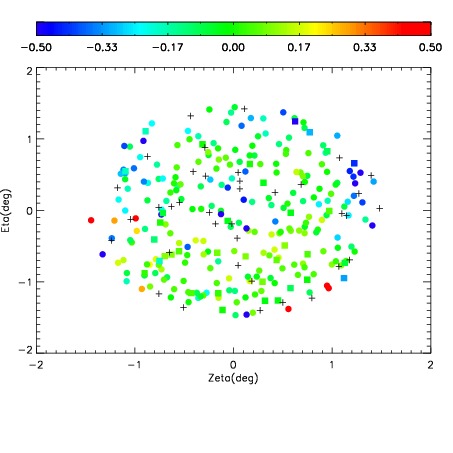
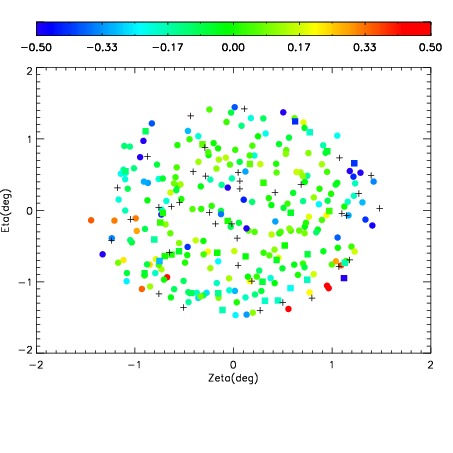
| Spatial mag deviation
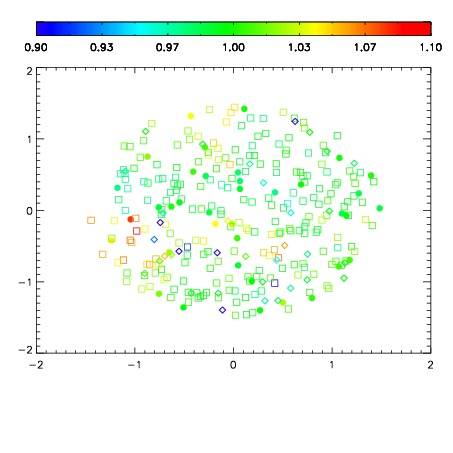
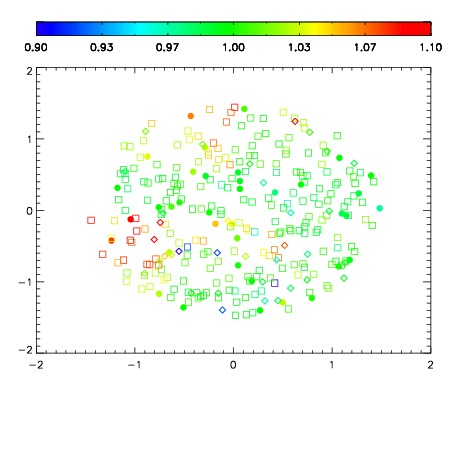
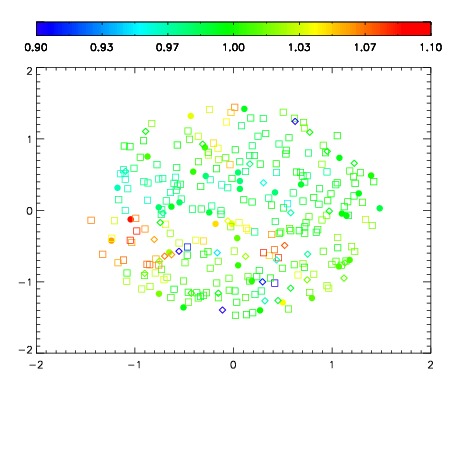
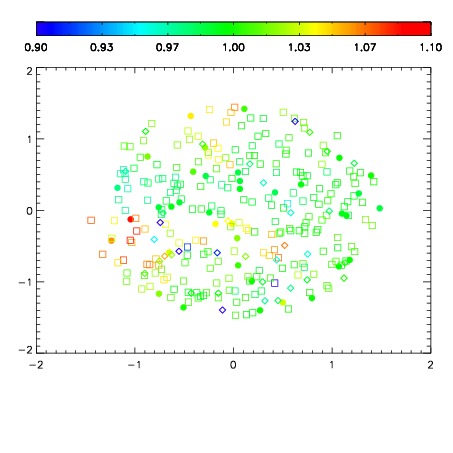
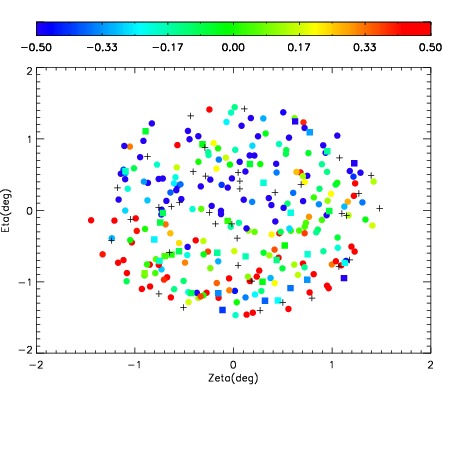
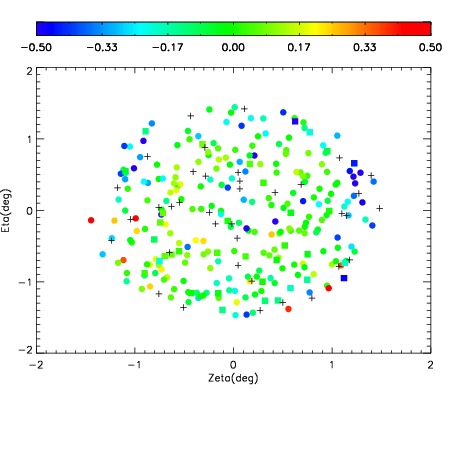
| Spatial sky 16325A emission deviations (filled: sky, open: star)
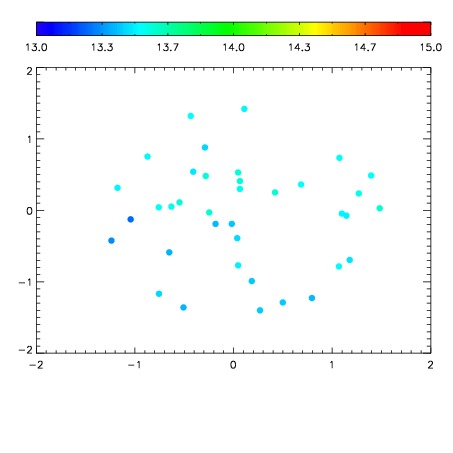
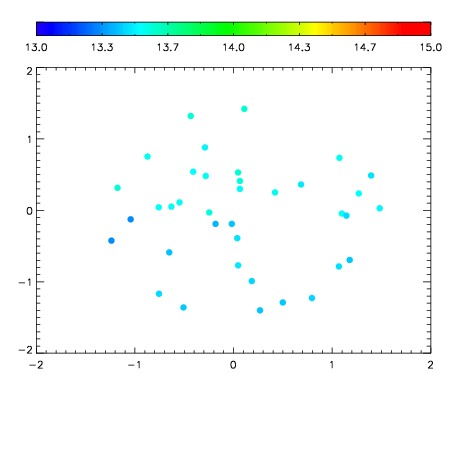
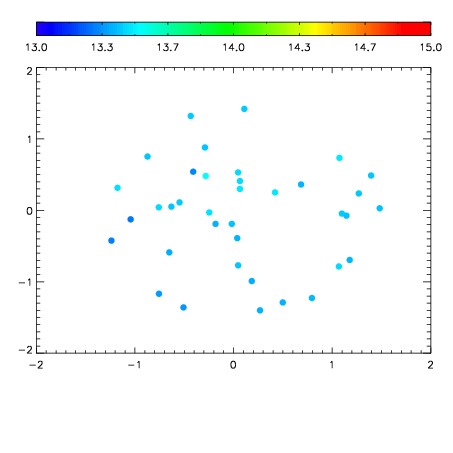
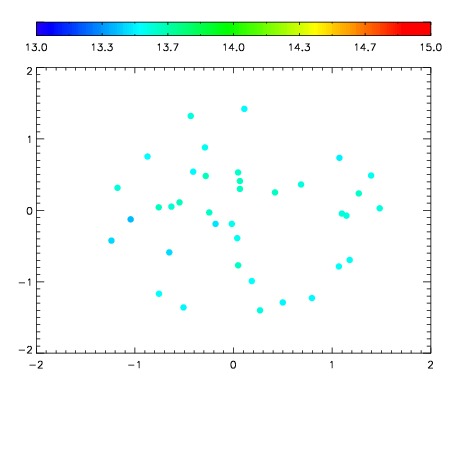
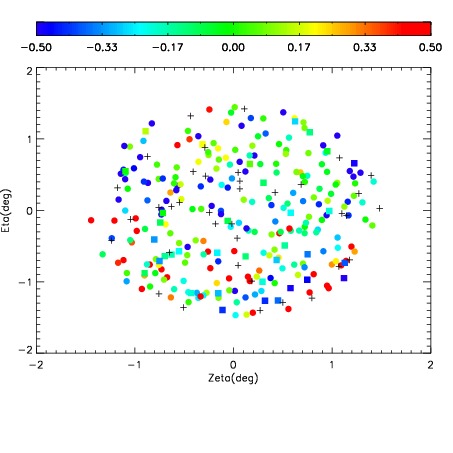
| Spatial sky continuum emission
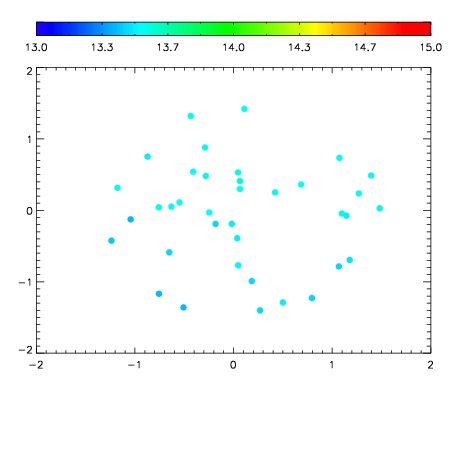
| Spatial sky telluric CO2 absorption deviations (filled: H < 10)
|
| 12340031
| 47
| | Red | Green | Blue
| | z | | 17.73
| | znorm | | 13.55
| | sky | 13.5 | 13.5 | 13.6
| | S/N | 5.4 | 10.2 | 9.7
| | S/N(c) | 11.8 | 21.5 | 10.6
| | SN(E/C) 1.03
|
| 
| 
| 
| 
| 
|
| 12340032
| 47
| | Red | Green | Blue
| | z | | 17.46
| | znorm | | 13.28
| | sky | 13.5 | 13.5 | 13.7
| | S/N | 4.6 | 8.0 | 8.7
| | S/N(c) | 9.6 | 17.2 | 8.7
| | SN(E/C) 1.05
|
| 
| 
| 
| 
| 
|
| 12340033
| 47
| | Red | Green | Blue
| | z | | 17.48
| | znorm | | 13.30
| | sky | 13.5 | 13.4 | 13.6
| | S/N | 4.7 | 8.3 | 8.7
| | S/N(c) | 10.3 | 18.5 | 9.2
| | SN(E/C) 1.00
|
| 
| 
| 
| 
| 
|
| 12340034
| 47
| | Red | Green | Blue
| | z | | 17.62
| | znorm | | 13.44
| | sky | 13.6 | 13.6 | 13.9
| | S/N | 5.0 | 9.4 | 9.9
| | S/N(c) | 11.4 | 20.0 | 10.2
| | SN(E/C) 0.96
|
| 
| 
| 
| 
| 
|
| 12340035
| 47
| | Red | Green | Blue
| | z | | 16.99
| | znorm | | 12.81
| | sky | 13.5 | 13.5 | 13.7
| | S/N | 3.0 | 5.7 | 6.0
| | S/N(c) | 6.4 | 12.7 | 6.6
| | SN(E/C) 1.00
|
| 
| 
| 
| 
| 
|
| 12340036
| 47
| | Red | Green | Blue
| | z | | 15.03
| | znorm | | 10.85
| | sky | 13.5 | 13.5 | 13.8
| | S/N | 0.4 | 1.1 | 1.0
| | S/N(c) | 0.0 | 0.0 | 0.0
| | SN(E/C) 1.34
|
| 
| 
| 
| 
| 
|
| 12340037
| 47
| | Red | Green | Blue
| | z | | 15.72
| | znorm | | 11.54
| | sky | 13.4 | 13.5 | 13.8
| | S/N | 0.8 | 2.1 | 2.0
| | S/N(c) | 2.1 | 4.5 | 2.7
| | SN(E/C) 1.10
|
| 
| 
| 
| 
| 
|
| 12340038
| 47
| | Red | Green | Blue
| | z | | 17.11
| | znorm | | 12.93
| | sky | 13.3 | 13.4 | 13.6
| | S/N | 3.3 | 6.1 | 6.5
| | S/N(c) | 7.2 | 13.7 | 7.2
| | SN(E/C) 1.04
|
| 
| 
| 
| 
| 
|

