| Red | Green | Blue | |
| z | 17.64 | ||
| znorm | Inf | ||
| sky | -Inf | -Inf | -NaN |
| S/N | 25.4 | 42.9 | 43.7 |
| S/N(c) | 0.0 | 0.0 | 0.0 |
| SN(E/C) |
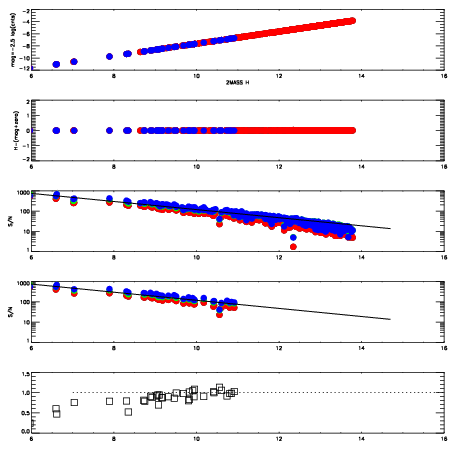
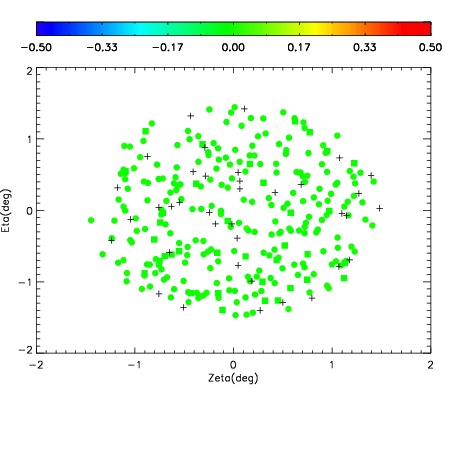
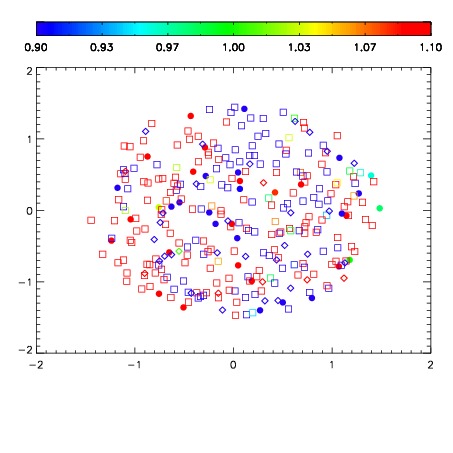
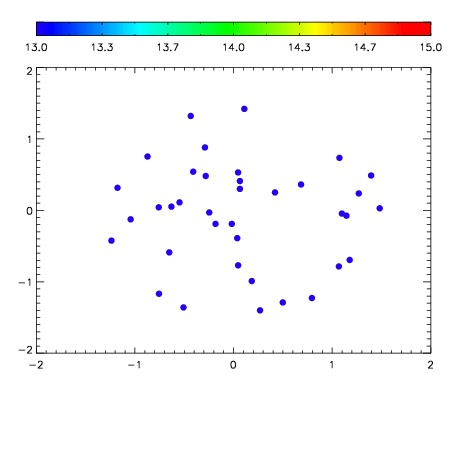

| Frame | Nreads | Zeropoints | Mag plots | Spatial mag deviation | Spatial sky 16325A emission deviations (filled: sky, open: star) | Spatial sky continuum emission | Spatial sky telluric CO2 absorption deviations (filled: H < 10) | |||||||||||||||||||||||
| 0 | 0 |
|
|
|
|
|
|
| IPAIR | NAME | SHIFT | NEWSHIFT | S/N | NAME | SHIFT | NEWSHIFT | S/N |
| 0 | 12440024 | 0.491537 | 0.00000 | 18.8353 | 12440025 | -0.00169402 | 0.493231 | 18.8623 |
| 1 | 12440028 | 0.490029 | 0.00150800 | 18.9382 | 12440029 | -0.00192347 | 0.493460 | 18.9441 |
| 2 | 12440023 | 0.491101 | 0.000436008 | 18.7748 | 12440026 | -0.000939221 | 0.492476 | 18.8064 |
| 3 | 12440027 | 0.490427 | 0.00111002 | 18.7459 | 12440022 | 0.00000 | 0.491537 | 18.4622 |