| Red | Green | Blue | |
| z | 17.64 | ||
| znorm | Inf | ||
| sky | -Inf | -Inf | -NaN |
| S/N | 7.0 | 13.7 | 12.7 |
| S/N(c) | 0.0 | 0.0 | 0.0 |
| SN(E/C) |
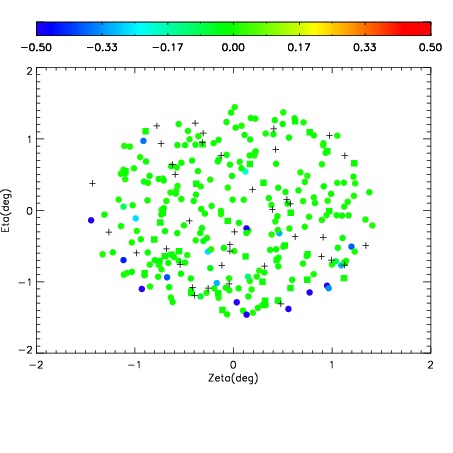
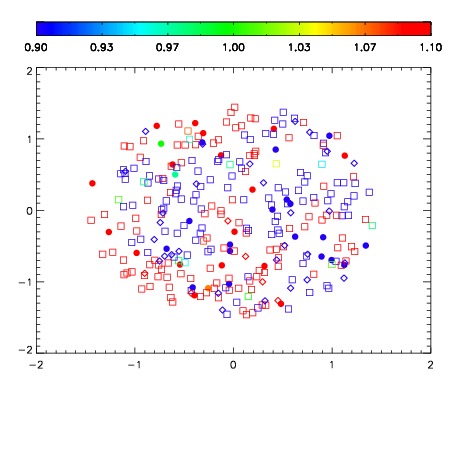
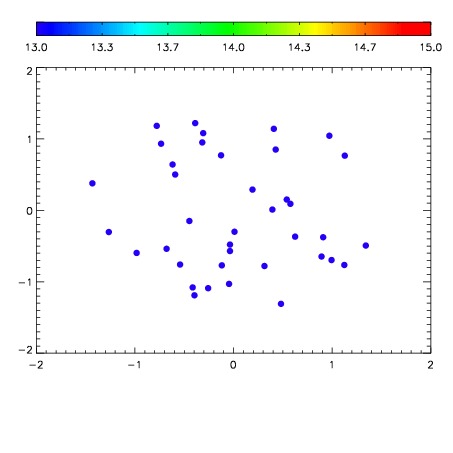

| Frame | Nreads | Zeropoints | Mag plots | Spatial mag deviation | Spatial sky 16325A emission deviations (filled: sky, open: star) | Spatial sky continuum emission | Spatial sky telluric CO2 absorption deviations (filled: H < 10) | |||||||||||||||||||||||
| 0 | 0 |
|
|
|
|
|
|
| IPAIR | NAME | SHIFT | NEWSHIFT | S/N | NAME | SHIFT | NEWSHIFT | S/N |
| 0 | 12260072 | 0.490640 | 0.00000 | 17.3710 | 12260074 | -0.00546787 | 0.496108 | 17.4177 |
| 1 | 12260075 | 0.488648 | 0.00199202 | 17.4368 | 12260073 | -0.00575974 | 0.496400 | 17.4523 |
| 2 | 12260071 | 0.488744 | 0.00189602 | 17.4074 | 12260070 | 0.00000 | 0.490640 | 17.4234 |