| Red | Green | Blue | |
| z | 17.64 | ||
| znorm | Inf | ||
| sky | -Inf | -Inf | -Inf |
| S/N | 12.4 | 20.4 | 21.3 |
| S/N(c) | 0.0 | 0.0 | 0.0 |
| SN(E/C) |
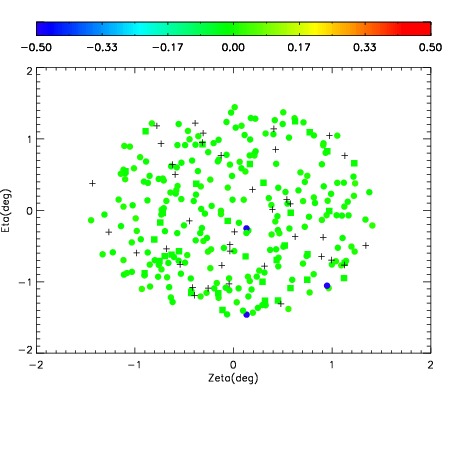
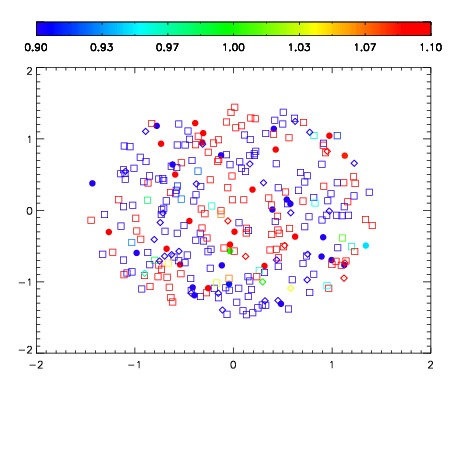
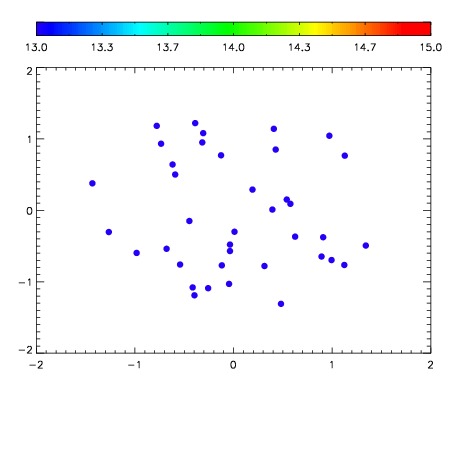

| Frame | Nreads | Zeropoints | Mag plots | Spatial mag deviation | Spatial sky 16325A emission deviations (filled: sky, open: star) | Spatial sky continuum emission | Spatial sky telluric CO2 absorption deviations (filled: H < 10) | |||||||||||||||||||||||
| 0 | 0 |
|
|
|
|
|
|
| IPAIR | NAME | SHIFT | NEWSHIFT | S/N | NAME | SHIFT | NEWSHIFT | S/N |
| 0 | 12330035 | 0.497143 | 0.00000 | 17.2801 | 12330036 | 0.000288944 | 0.496854 | 15.6081 |
| 1 | 12330039 | 0.496796 | 0.000346988 | 18.5330 | 12330040 | -0.00162526 | 0.498768 | 18.9167 |
| 2 | 12330038 | 0.496038 | 0.00110501 | 17.7316 | 12330037 | 0.000620252 | 0.496523 | 15.9379 |
| 3 | 12330034 | 0.496609 | 0.000533998 | 17.4248 | 12330033 | 0.00000 | 0.497143 | 15.8939 |