| Red | Green | Blue | |
| z | 17.64 | ||
| znorm | Inf | ||
| sky | -Inf | -Inf | -Inf |
| S/N | 22.0 | 36.5 | 38.5 |
| S/N(c) | 0.0 | 0.0 | 0.0 |
| SN(E/C) |
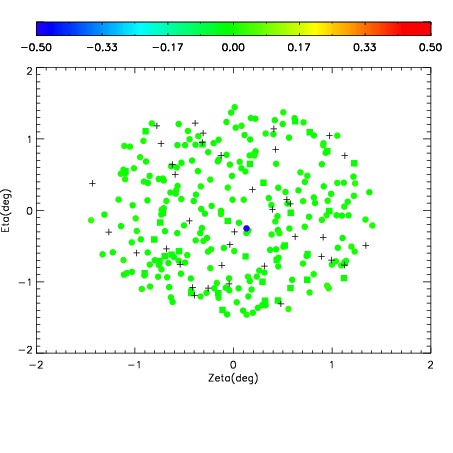
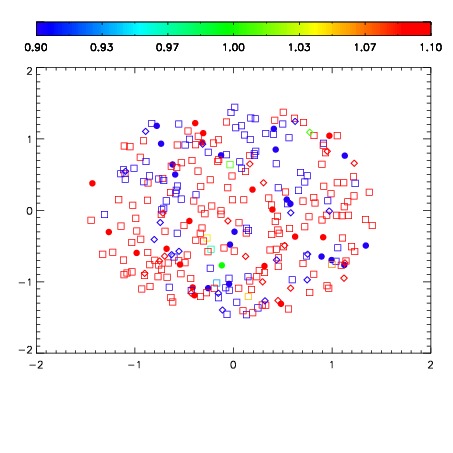
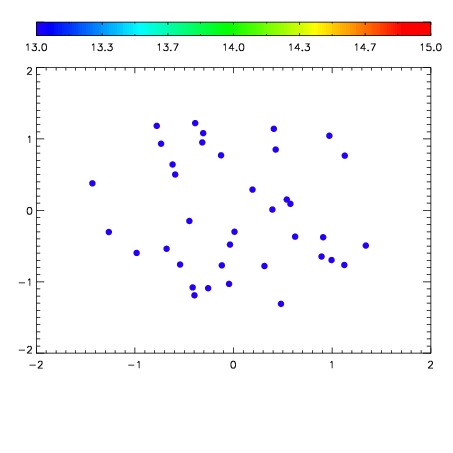

| Frame | Nreads | Zeropoints | Mag plots | Spatial mag deviation | Spatial sky 16325A emission deviations (filled: sky, open: star) | Spatial sky continuum emission | Spatial sky telluric CO2 absorption deviations (filled: H < 10) | |||||||||||||||||||||||
| 0 | 0 |
|
|
|
|
|
|
| IPAIR | NAME | SHIFT | NEWSHIFT | S/N | NAME | SHIFT | NEWSHIFT | S/N |
| 0 | 12400017 | 0.493121 | 0.00000 | 18.7243 | 12400018 | -0.000421960 | 0.493543 | 18.8293 |
| 1 | 12400020 | 0.491576 | 0.00154501 | 18.7099 | 12400019 | 0.000681539 | 0.492439 | 18.7344 |
| 2 | 12400021 | 0.492038 | 0.00108299 | 18.6893 | 12400022 | -0.00400378 | 0.497125 | 18.6511 |
| 3 | 12400016 | 0.492604 | 0.000517011 | 18.6589 | 12400015 | 0.00000 | 0.493121 | 18.5143 |