| Red | Green | Blue | |
| z | 17.64 | ||
| znorm | Inf | ||
| sky | -NaN | -Inf | -NaN |
| S/N | 29.2 | 49.9 | 53.5 |
| S/N(c) | 0.0 | 0.0 | 0.0 |
| SN(E/C) |
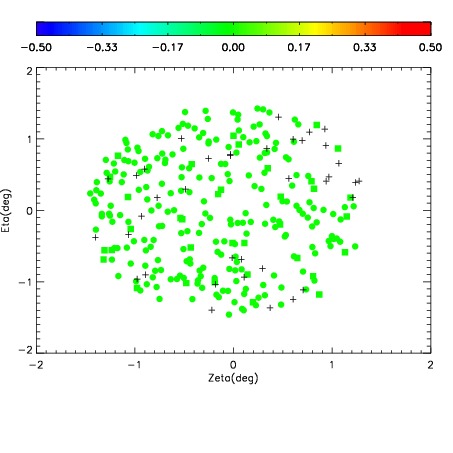


| Frame | Nreads | Zeropoints | Mag plots | Spatial mag deviation | Spatial sky 16325A emission deviations (filled: sky, open: star) | Spatial sky continuum emission | Spatial sky telluric CO2 absorption deviations (filled: H < 10) | |||||||||||||||||||||||
| 0 | 0 |
|
|
|
|
|
|
| IPAIR | NAME | SHIFT | NEWSHIFT | S/N | NAME | SHIFT | NEWSHIFT | S/N |
| 0 | 12480035 | 0.496332 | 0.00000 | 19.1571 | 12480033 | 0.00000 | 0.496332 | 19.1368 |
| 1 | 12480034 | 0.495294 | 0.00103799 | 19.1506 | 12480037 | 0.000501369 | 0.495831 | 19.1333 |
| 2 | 12480038 | 0.494949 | 0.00138298 | 19.0729 | 12480036 | -0.000460790 | 0.496793 | 19.1121 |
| 3 | 12480039 | 0.494636 | 0.00169599 | 19.0269 | 12480040 | 0.00203434 | 0.494298 | 19.0735 |