| Red | Green | Blue | |
| z | 17.64 | ||
| znorm | Inf | ||
| sky | -Inf | -Inf | -NaN |
| S/N | 20.8 | 35.0 | 36.5 |
| S/N(c) | 0.0 | 0.0 | 0.0 |
| SN(E/C) |
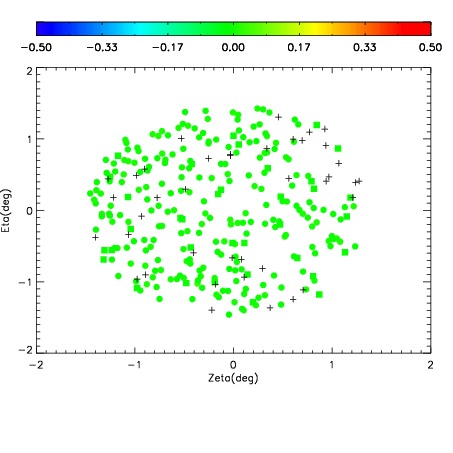


| Frame | Nreads | Zeropoints | Mag plots | Spatial mag deviation | Spatial sky 16325A emission deviations (filled: sky, open: star) | Spatial sky continuum emission | Spatial sky telluric CO2 absorption deviations (filled: H < 10) | |||||||||||||||||||||||
| 0 | 0 |
|
|
|
|
|
|
| IPAIR | NAME | SHIFT | NEWSHIFT | S/N | NAME | SHIFT | NEWSHIFT | S/N |
| 0 | 12630024 | 0.485241 | 0.00000 | 18.4781 | 12630025 | -0.00243192 | 0.487673 | 18.8843 |
| 1 | 12630023 | 0.484151 | 0.00108999 | 18.9160 | 12630022 | 0.00000 | 0.485241 | 18.9722 |
| 2 | 12630028 | 0.484380 | 0.000860989 | 18.3210 | 12630026 | -0.00240451 | 0.487646 | 18.8370 |
| 3 | 12630027 | 0.484173 | 0.00106800 | 17.5897 | 12630029 | -0.00205614 | 0.487297 | 18.5898 |