| Red | Green | Blue | |
| z | 17.64 | ||
| znorm | Inf | ||
| sky | -Inf | -Inf | -Inf |
| S/N | 26.5 | 46.8 | 50.2 |
| S/N(c) | 0.0 | 0.0 | 0.0 |
| SN(E/C) |
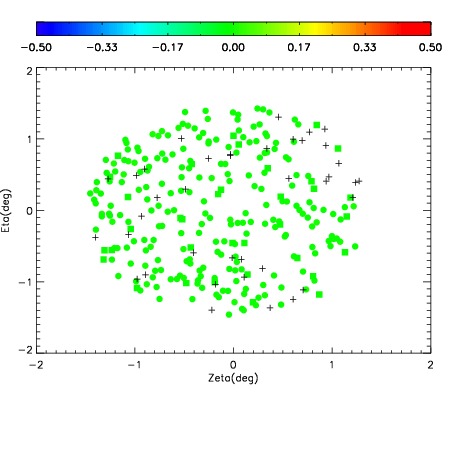
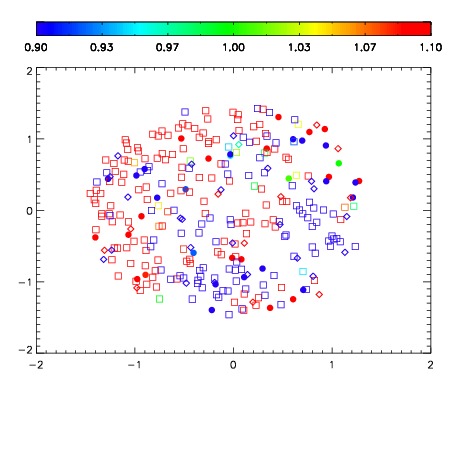


| Frame | Nreads | Zeropoints | Mag plots | Spatial mag deviation | Spatial sky 16325A emission deviations (filled: sky, open: star) | Spatial sky continuum emission | Spatial sky telluric CO2 absorption deviations (filled: H < 10) | |||||||||||||||||||||||
| 0 | 0 |
|
|
|
|
|
|
| IPAIR | NAME | SHIFT | NEWSHIFT | S/N | NAME | SHIFT | NEWSHIFT | S/N |
| 0 | 12680054 | 0.492054 | 0.00000 | 18.4669 | 12680055 | 0.00340426 | 0.488650 | 18.9283 |
| 1 | 12680049 | 0.488999 | 0.00305498 | 19.0841 | 12680052 | 0.00185494 | 0.490199 | 19.1009 |
| 2 | 12680053 | 0.491237 | 0.000816971 | 19.0742 | 12680048 | 0.00000 | 0.492054 | 19.0854 |
| 3 | 12680050 | 0.489973 | 0.00208098 | 19.0379 | 12680051 | 0.00174340 | 0.490311 | 19.0197 |