| Red | Green | Blue | |
| z | 17.64 | ||
| znorm | Inf | ||
| sky | -Inf | -Inf | -Inf |
| S/N | 23.8 | 41.2 | 44.0 |
| S/N(c) | 0.0 | 0.0 | 0.0 |
| SN(E/C) |
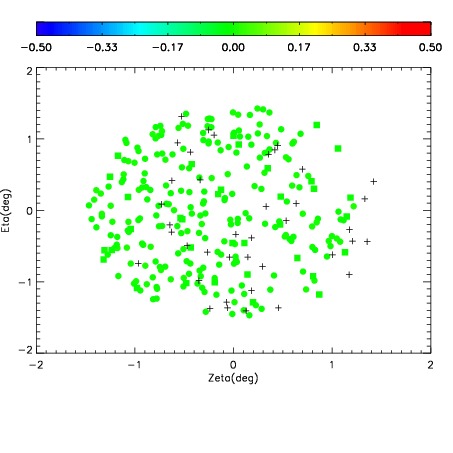
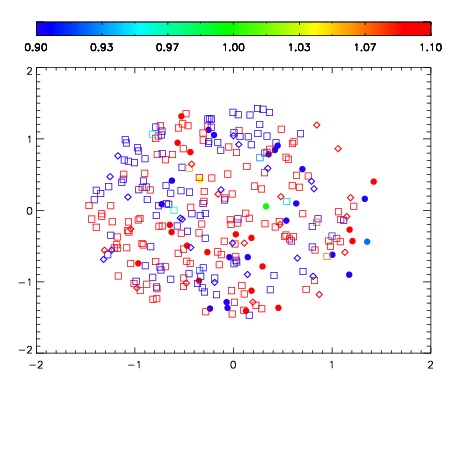
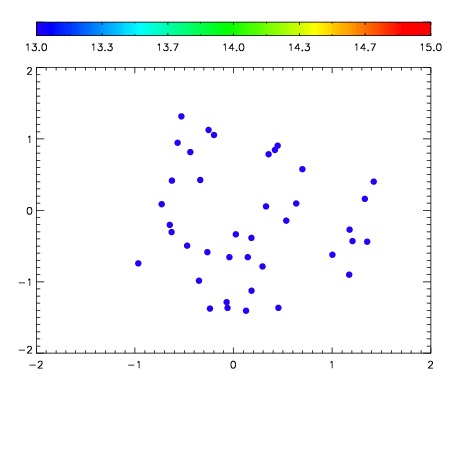

| Frame | Nreads | Zeropoints | Mag plots | Spatial mag deviation | Spatial sky 16325A emission deviations (filled: sky, open: star) | Spatial sky continuum emission | Spatial sky telluric CO2 absorption deviations (filled: H < 10) | |||||||||||||||||||||||
| 0 | 0 |
|
|
|
|
|
|
| IPAIR | NAME | SHIFT | NEWSHIFT | S/N | NAME | SHIFT | NEWSHIFT | S/N |
| 0 | 12620039 | 0.486850 | 0.00000 | 19.0369 | 12620040 | 0.00248026 | 0.484370 | 19.0183 |
| 1 | 12620038 | 0.486500 | 0.000349998 | 19.0123 | 12620036 | 0.000617690 | 0.486232 | 18.9054 |
| 2 | 12620035 | 0.485623 | 0.00122699 | 18.8536 | 12620037 | 0.00120870 | 0.485641 | 18.9007 |
| 3 | 12620034 | 0.485894 | 0.000955999 | 18.7699 | 12620033 | 0.00000 | 0.486850 | 18.6900 |