| Red | Green | Blue | |
| z | 17.64 | ||
| znorm | Inf | ||
| sky | -Inf | -NaN | -Inf |
| S/N | 21.8 | 38.4 | 41.3 |
| S/N(c) | 0.0 | 0.0 | 0.0 |
| SN(E/C) |
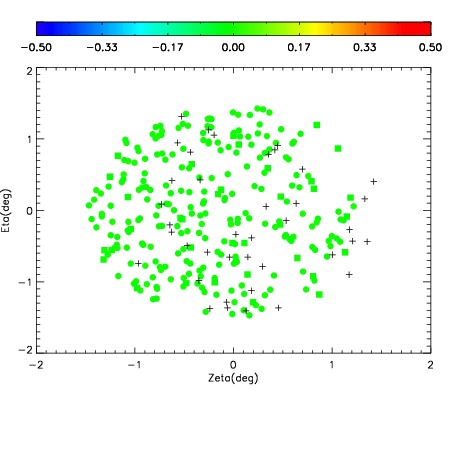
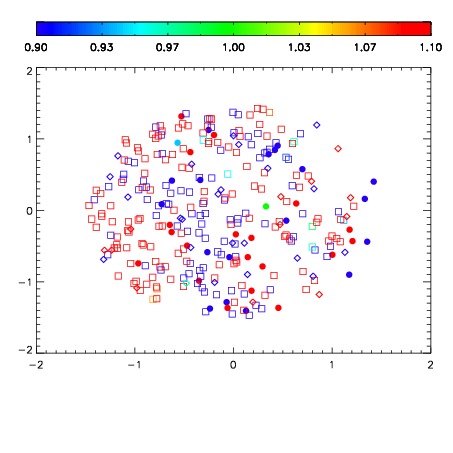


| Frame | Nreads | Zeropoints | Mag plots | Spatial mag deviation | Spatial sky 16325A emission deviations (filled: sky, open: star) | Spatial sky continuum emission | Spatial sky telluric CO2 absorption deviations (filled: H < 10) | |||||||||||||||||||||||
| 0 | 0 |
|
|
|
|
|
|
| IPAIR | NAME | SHIFT | NEWSHIFT | S/N | NAME | SHIFT | NEWSHIFT | S/N |
| 0 | 12680043 | 0.488602 | 0.00000 | 19.0219 | 12680044 | -0.00229214 | 0.490894 | 19.0423 |
| 1 | 12680042 | 0.488212 | 0.000390023 | 18.9892 | 12680041 | -0.00125678 | 0.489859 | 18.9935 |
| 2 | 12680039 | 0.488475 | 0.000127017 | 18.8464 | 12680040 | -0.00108685 | 0.489689 | 18.9020 |
| 3 | 12680038 | 0.488308 | 0.000294000 | 18.4337 | 12680037 | 0.00000 | 0.488602 | 18.2017 |