| Red | Green | Blue | |
| z | 17.64 | ||
| znorm | Inf | ||
| sky | -Inf | -Inf | -Inf |
| S/N | 27.4 | 46.4 | 49.3 |
| S/N(c) | 0.0 | 0.0 | 0.0 |
| SN(E/C) |
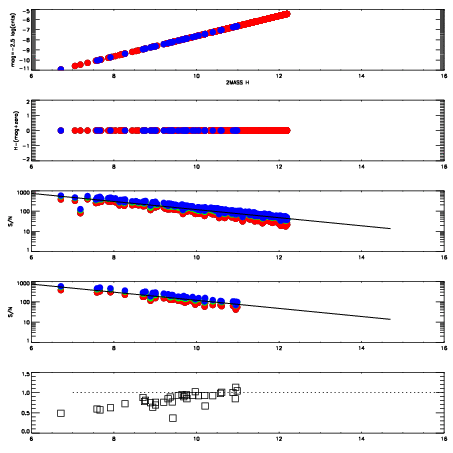
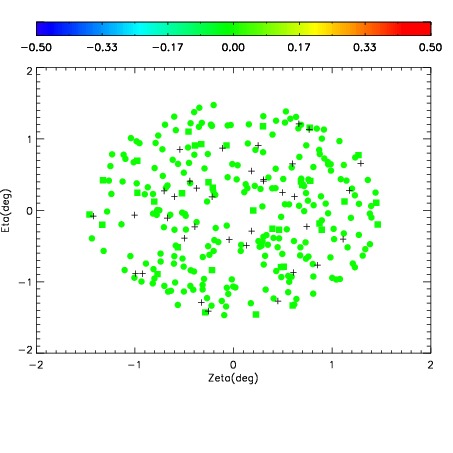
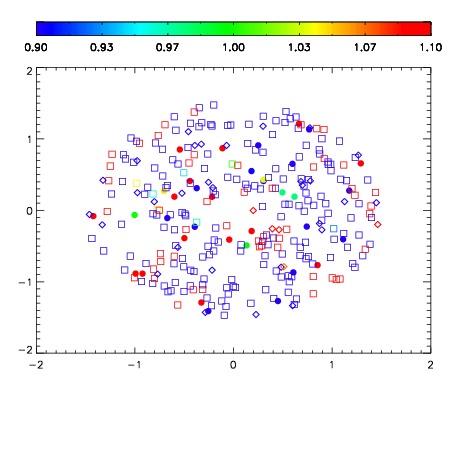
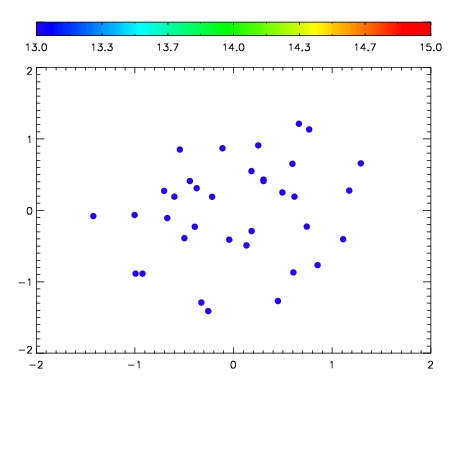

| Frame | Nreads | Zeropoints | Mag plots | Spatial mag deviation | Spatial sky 16325A emission deviations (filled: sky, open: star) | Spatial sky continuum emission | Spatial sky telluric CO2 absorption deviations (filled: H < 10) | |||||||||||||||||||||||
| 0 | 0 |
|
|
|
|
|
|
| IPAIR | NAME | SHIFT | NEWSHIFT | S/N | NAME | SHIFT | NEWSHIFT | S/N |
| 0 | 08720013 | 0.469025 | 0.00000 | 19.0152 | 08720014 | 0.00142050 | 0.467604 | 19.0125 |
| 1 | 08720016 | 0.467120 | 0.00190499 | 19.0684 | 08720011 | 0.00000 | 0.469025 | 19.0525 |
| 2 | 08720017 | 0.467015 | 0.00200999 | 19.0683 | 08720015 | 0.00111389 | 0.467911 | 19.0335 |
| 3 | 08720012 | 0.468817 | 0.000207990 | 19.0280 | 08720018 | -0.00263848 | 0.471663 | 19.0283 |