| Red | Green | Blue | |
| z | 17.64 | ||
| znorm | Inf | ||
| sky | -Inf | -Inf | -Inf |
| S/N | 22.6 | 40.7 | 43.4 |
| S/N(c) | 0.0 | 0.0 | 0.0 |
| SN(E/C) |
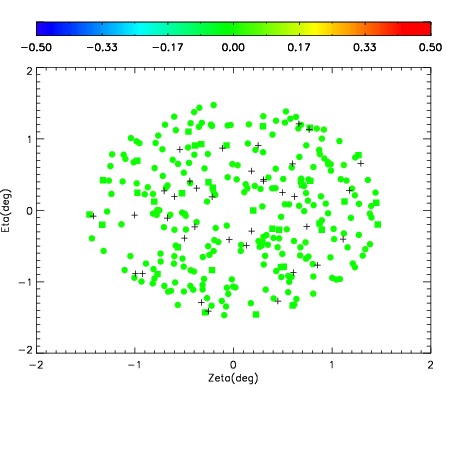
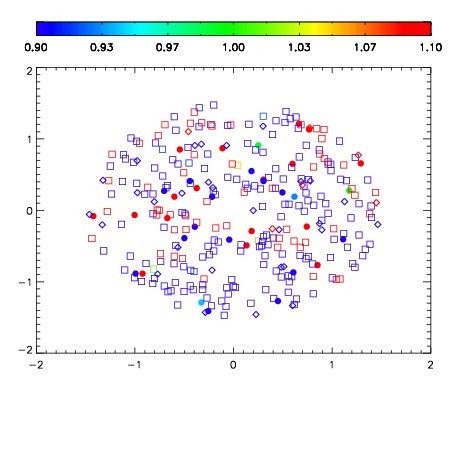
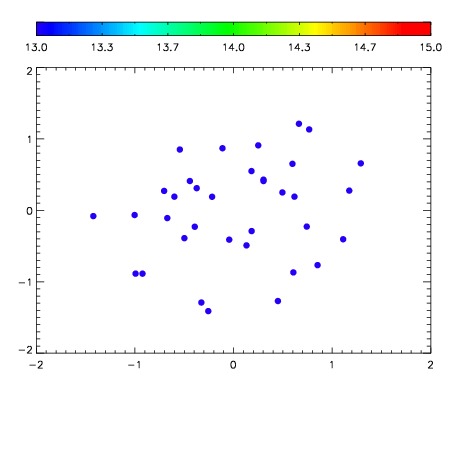

| Frame | Nreads | Zeropoints | Mag plots | Spatial mag deviation | Spatial sky 16325A emission deviations (filled: sky, open: star) | Spatial sky continuum emission | Spatial sky telluric CO2 absorption deviations (filled: H < 10) | |||||||||||||||||||||||
| 0 | 0 |
|
|
|
|
|
|
| IPAIR | NAME | SHIFT | NEWSHIFT | S/N | NAME | SHIFT | NEWSHIFT | S/N |
| 0 | 08800013 | 0.473458 | 0.00000 | 18.8279 | 08800018 | -0.000615206 | 0.474073 | 18.8603 |
| 1 | 08800017 | 0.470500 | 0.00295800 | 18.7708 | 08800014 | -0.000188080 | 0.473646 | 18.8595 |
| 2 | 08800016 | 0.471225 | 0.00223300 | 18.7525 | 08800015 | -0.000257628 | 0.473716 | 18.8488 |
| 3 | 08800012 | 0.473255 | 0.000202984 | 18.7104 | 08800011 | 0.00000 | 0.473458 | 18.5586 |