| Red | Green | Blue | |
| z | 17.64 | ||
| znorm | Inf | ||
| sky | -NaN | -NaN | -Inf |
| S/N | 31.5 | 50.7 | 52.4 |
| S/N(c) | 0.0 | 0.0 | 0.0 |
| SN(E/C) |
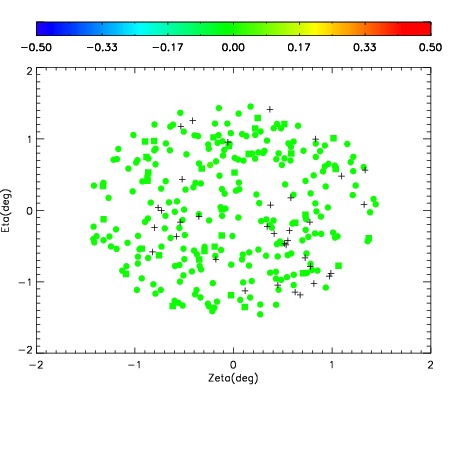
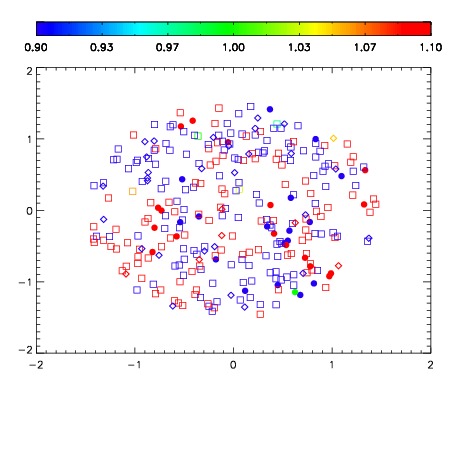
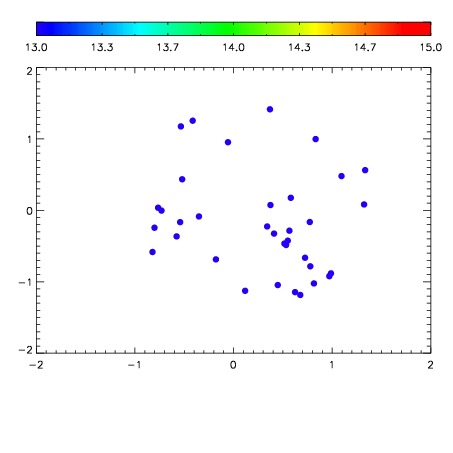

| Frame | Nreads | Zeropoints | Mag plots | Spatial mag deviation | Spatial sky 16325A emission deviations (filled: sky, open: star) | Spatial sky continuum emission | Spatial sky telluric CO2 absorption deviations (filled: H < 10) | |||||||||||||||||||||||
| 0 | 0 |
|
|
|
|
|
|
| IPAIR | NAME | SHIFT | NEWSHIFT | S/N | NAME | SHIFT | NEWSHIFT | S/N |
| 0 | 10270012 | 0.494600 | 0.00000 | 19.1719 | 10270011 | 0.00000 | 0.494600 | 19.0996 |
| 1 | 10270017 | 0.494029 | 0.000571012 | 19.2273 | 10270014 | 0.00234071 | 0.492259 | 19.2167 |
| 2 | 10270013 | 0.493574 | 0.00102600 | 19.2113 | 10270015 | 0.00260424 | 0.491996 | 19.2108 |
| 3 | 10270016 | 0.493419 | 0.00118101 | 19.2034 | 10270018 | 0.00342921 | 0.491171 | 19.2077 |