| Red | Green | Blue | |
| z | 17.64 | ||
| znorm | Inf | ||
| sky | -NaN | -NaN | -Inf |
| S/N | 27.5 | 45.8 | 47.6 |
| S/N(c) | 0.0 | 0.0 | 0.0 |
| SN(E/C) |
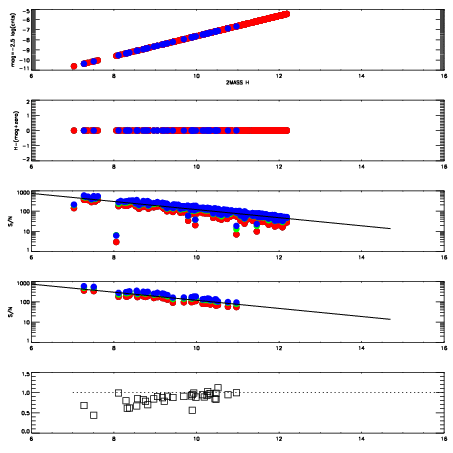
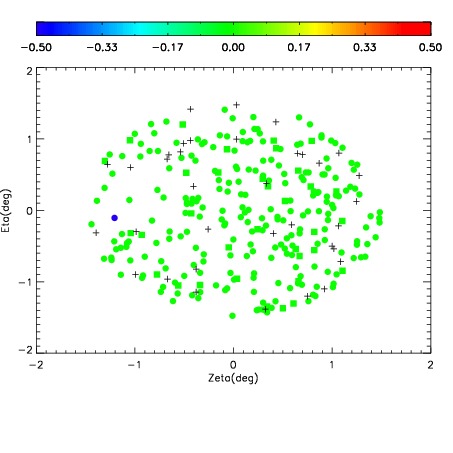
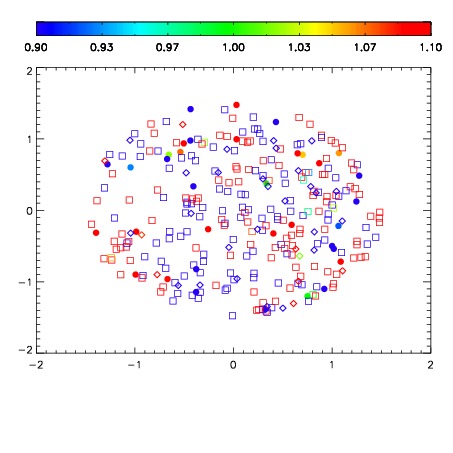
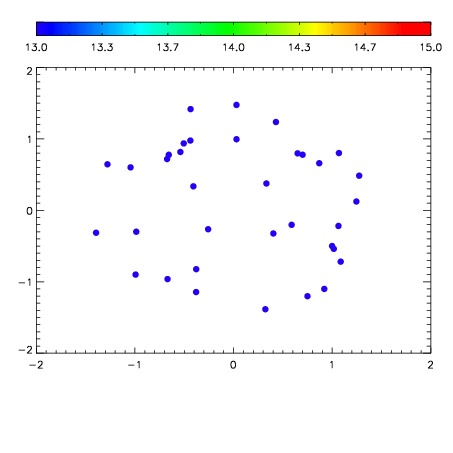

| Frame | Nreads | Zeropoints | Mag plots | Spatial mag deviation | Spatial sky 16325A emission deviations (filled: sky, open: star) | Spatial sky continuum emission | Spatial sky telluric CO2 absorption deviations (filled: H < 10) | |||||||||||||||||||||||
| 0 | 0 |
|
|
|
|
|
|
| IPAIR | NAME | SHIFT | NEWSHIFT | S/N | NAME | SHIFT | NEWSHIFT | S/N |
| 0 | 10410012 | 0.515234 | 0.00000 | 19.0239 | 10410018 | 0.00268630 | 0.512548 | 19.0068 |
| 1 | 10410013 | 0.515038 | 0.000195980 | 19.0173 | 10410011 | 0.00000 | 0.515234 | 18.9729 |
| 2 | 10410016 | 0.514603 | 0.000630975 | 18.9956 | 10410015 | 0.00195868 | 0.513275 | 18.9449 |
| 3 | 10410017 | 0.515127 | 0.000106990 | 18.9553 | 10410014 | 0.00222474 | 0.513009 | 18.9367 |