| Red | Green | Blue | |
| z | 17.64 | ||
| znorm | Inf | ||
| sky | -Inf | -NaN | -Inf |
| S/N | 29.4 | 49.3 | 52.1 |
| S/N(c) | 0.0 | 0.0 | 0.0 |
| SN(E/C) |
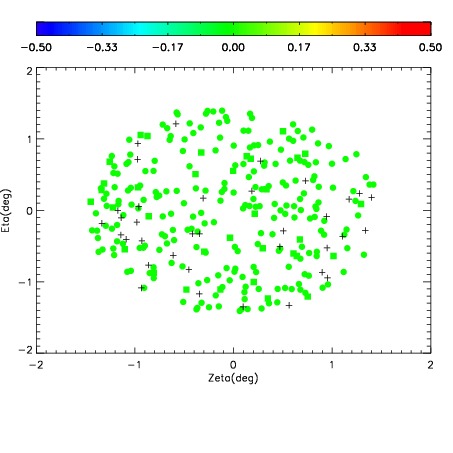
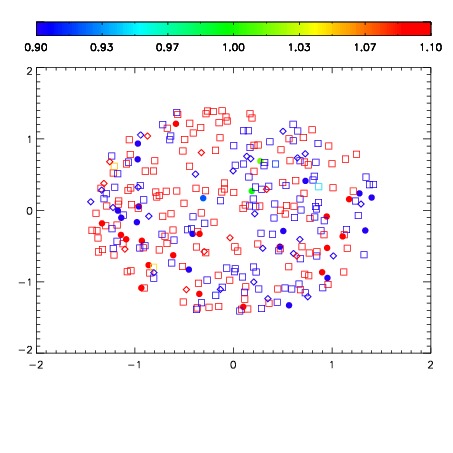
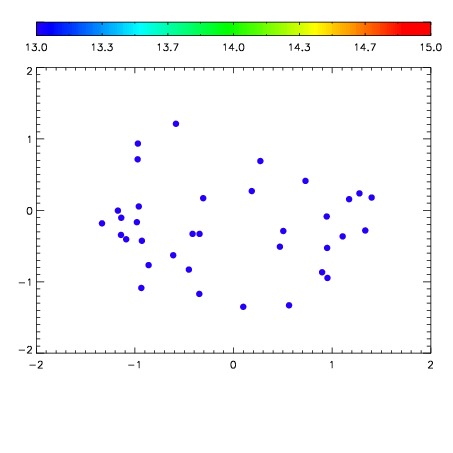

| Frame | Nreads | Zeropoints | Mag plots | Spatial mag deviation | Spatial sky 16325A emission deviations (filled: sky, open: star) | Spatial sky continuum emission | Spatial sky telluric CO2 absorption deviations (filled: H < 10) | |||||||||||||||||||||||
| 0 | 0 |
|
|
|
|
|
|
| IPAIR | NAME | SHIFT | NEWSHIFT | S/N | NAME | SHIFT | NEWSHIFT | S/N |
| 0 | 06700012 | 0.481847 | 0.00000 | 19.1144 | 06700013 | 0.00156716 | 0.480280 | 19.1136 |
| 1 | 06700016 | 0.481296 | 0.000550985 | 19.1252 | 06700017 | 3.15285e-05 | 0.481815 | 19.1510 |
| 2 | 06700011 | 0.481574 | 0.000272989 | 19.1045 | 06700014 | -0.000490224 | 0.482337 | 19.1136 |
| 3 | 06700015 | 0.481582 | 0.000265002 | 19.0994 | 06700010 | 0.00000 | 0.481847 | 19.0954 |