| Red | Green | Blue | |
| z | 17.64 | ||
| znorm | Inf | ||
| sky | -NaN | -NaN | -Inf |
| S/N | 26.4 | 44.6 | 46.2 |
| S/N(c) | 0.0 | 0.0 | 0.0 |
| SN(E/C) |
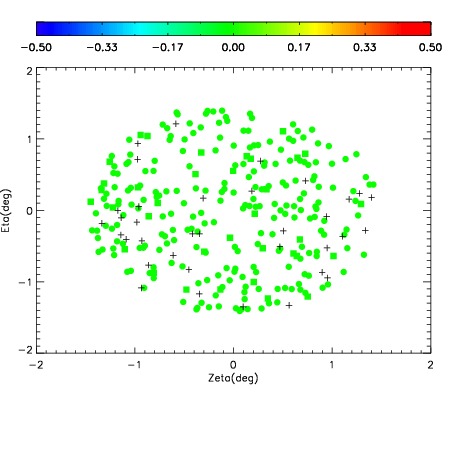
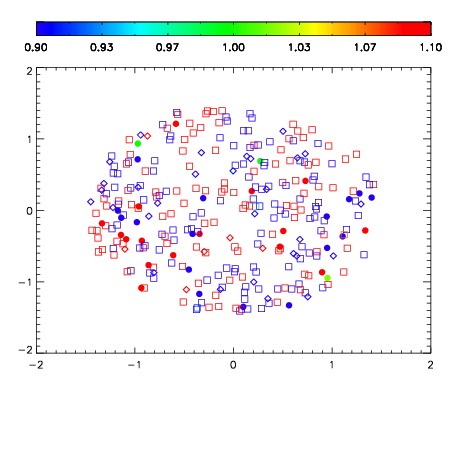
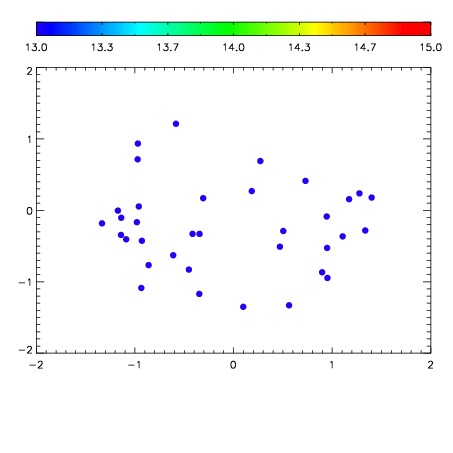

| Frame | Nreads | Zeropoints | Mag plots | Spatial mag deviation | Spatial sky 16325A emission deviations (filled: sky, open: star) | Spatial sky continuum emission | Spatial sky telluric CO2 absorption deviations (filled: H < 10) | |||||||||||||||||||||||
| 0 | 0 |
|
|
|
|
|
|
| IPAIR | NAME | SHIFT | NEWSHIFT | S/N | NAME | SHIFT | NEWSHIFT | S/N |
| 0 | 10150017 | 0.495041 | 0.00000 | 18.8914 | 10150015 | 0.00315483 | 0.491886 | 18.8781 |
| 1 | 10150012 | 0.493727 | 0.00131401 | 19.0223 | 10150011 | 0.00000 | 0.495041 | 18.9922 |
| 2 | 10150013 | 0.493450 | 0.00159103 | 19.0187 | 10150014 | 0.00253557 | 0.492505 | 18.9540 |
| 3 | 10150016 | 0.494489 | 0.000551999 | 18.9341 | 10150018 | 0.00257662 | 0.492464 | 18.9450 |