| Red | Green | Blue | |
| z | 17.64 | ||
| znorm | Inf | ||
| sky | -Inf | -Inf | -Inf |
| S/N | 27.8 | 46.0 | 46.9 |
| S/N(c) | 0.0 | 0.0 | 0.0 |
| SN(E/C) |
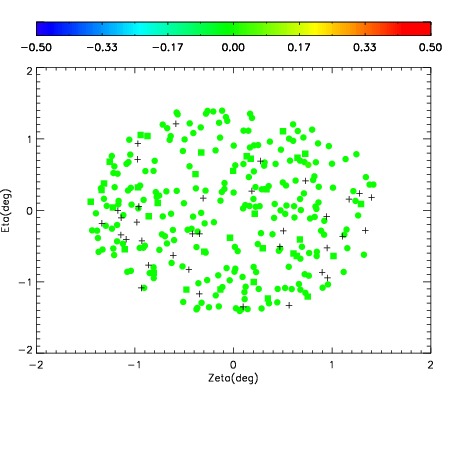
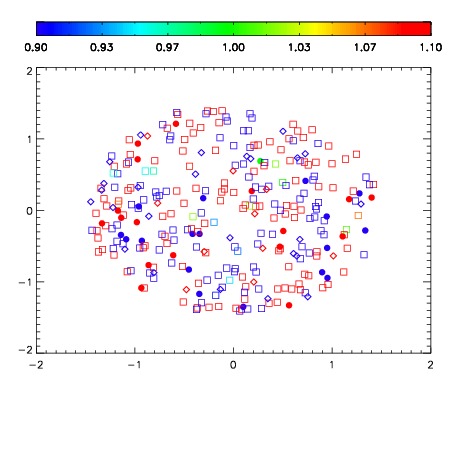
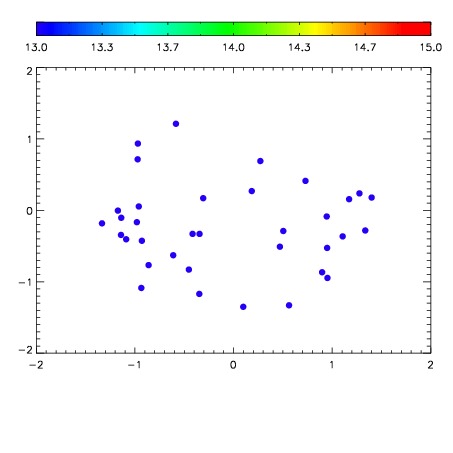

| Frame | Nreads | Zeropoints | Mag plots | Spatial mag deviation | Spatial sky 16325A emission deviations (filled: sky, open: star) | Spatial sky continuum emission | Spatial sky telluric CO2 absorption deviations (filled: H < 10) | |||||||||||||||||||||||
| 0 | 0 |
|
|
|
|
|
|
| IPAIR | NAME | SHIFT | NEWSHIFT | S/N | NAME | SHIFT | NEWSHIFT | S/N |
| 0 | 10450013 | 0.504246 | 0.00000 | 19.0405 | 10450011 | 0.00000 | 0.504246 | 18.9610 |
| 1 | 10450017 | 0.504087 | 0.000159025 | 19.0928 | 10450015 | 0.00245225 | 0.501794 | 19.0589 |
| 2 | 10450016 | 0.504112 | 0.000133991 | 19.0886 | 10450018 | 0.00213473 | 0.502111 | 19.0364 |
| 3 | 10450012 | 0.503707 | 0.000539005 | 19.0835 | 10450014 | 0.00272922 | 0.501517 | 19.0264 |