| Red | Green | Blue | |
| z | 17.64 | ||
| znorm | Inf | ||
| sky | -Inf | -NaN | -Inf |
| S/N | 22.8 | 40.0 | 42.2 |
| S/N(c) | 0.0 | 0.0 | 0.0 |
| SN(E/C) |
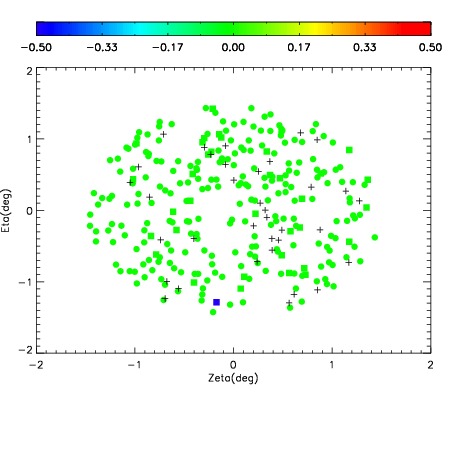
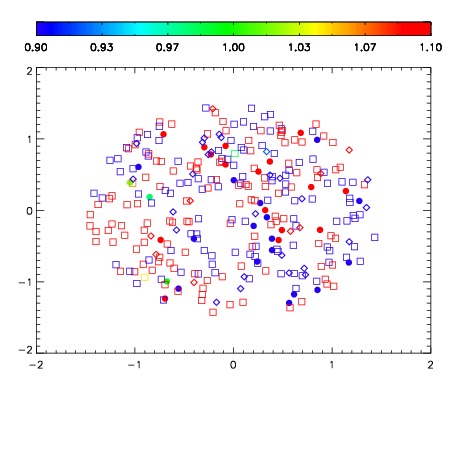
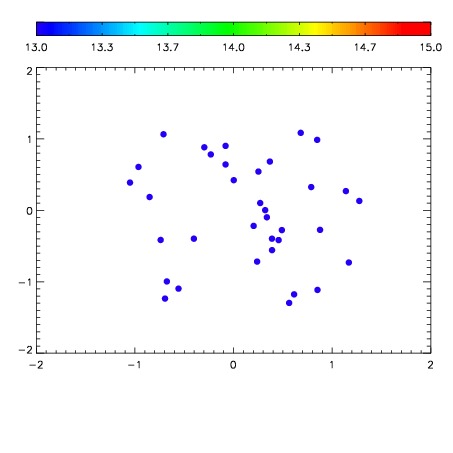

| Frame | Nreads | Zeropoints | Mag plots | Spatial mag deviation | Spatial sky 16325A emission deviations (filled: sky, open: star) | Spatial sky continuum emission | Spatial sky telluric CO2 absorption deviations (filled: H < 10) | |||||||||||||||||||||||
| 0 | 0 |
|
|
|
|
|
|
| IPAIR | NAME | SHIFT | NEWSHIFT | S/N | NAME | SHIFT | NEWSHIFT | S/N |
| 0 | 10420012 | 0.512224 | 0.00000 | 18.4920 | 10420011 | 0.00000 | 0.512224 | 18.6494 |
| 1 | 10420017 | 0.509170 | 0.00305402 | 18.8590 | 10420014 | 0.00119540 | 0.511029 | 18.9046 |
| 2 | 10420016 | 0.508916 | 0.00330800 | 18.8207 | 10420015 | 0.000953676 | 0.511270 | 18.8700 |
| 3 | 10420013 | 0.511815 | 0.000409007 | 18.8099 | 10420018 | 0.00140620 | 0.510818 | 18.8280 |