| Red | Green | Blue | |
| z | 17.64 | ||
| znorm | Inf | ||
| sky | -NaN | -NaN | -Inf |
| S/N | 25.2 | 41.9 | 44.6 |
| S/N(c) | 0.0 | 0.0 | 0.0 |
| SN(E/C) |
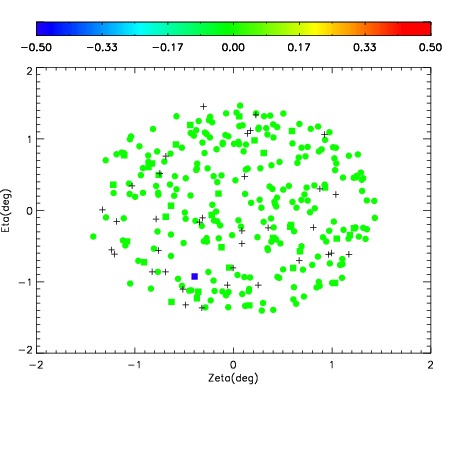
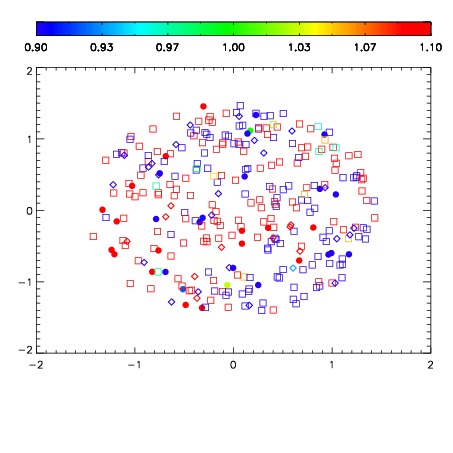
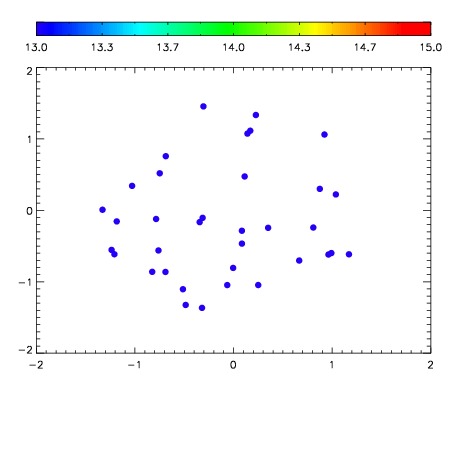

| Frame | Nreads | Zeropoints | Mag plots | Spatial mag deviation | Spatial sky 16325A emission deviations (filled: sky, open: star) | Spatial sky continuum emission | Spatial sky telluric CO2 absorption deviations (filled: H < 10) | |||||||||||||||||||||||
| 0 | 0 |
|
|
|
|
|
|
| IPAIR | NAME | SHIFT | NEWSHIFT | S/N | NAME | SHIFT | NEWSHIFT | S/N |
| 0 | 06690017 | 0.483966 | 0.00000 | 18.9961 | 06690011 | 0.00000 | 0.483966 | 18.9505 |
| 1 | 06690016 | 0.483599 | 0.000366986 | 19.0339 | 06690018 | 0.000128085 | 0.483838 | 19.0248 |
| 2 | 06690013 | 0.482873 | 0.00109300 | 18.9762 | 06690014 | -0.000688913 | 0.484655 | 18.9348 |
| 3 | 06690012 | 0.482841 | 0.00112498 | 18.9127 | 06690015 | -0.00446599 | 0.488432 | 18.9180 |