| Red | Green | Blue | |
| z | 17.64 | ||
| znorm | Inf | ||
| sky | -Inf | -NaN | -Inf |
| S/N | 28.1 | 45.5 | 49.0 |
| S/N(c) | 0.0 | 0.0 | 0.0 |
| SN(E/C) |
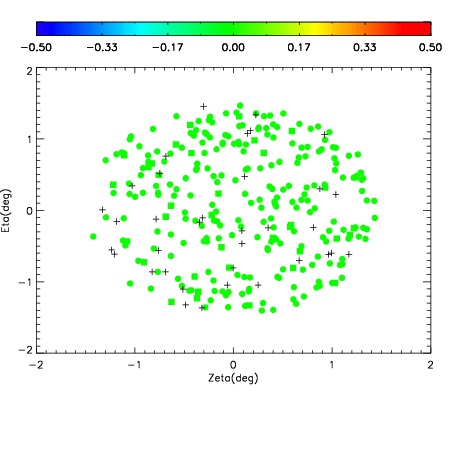
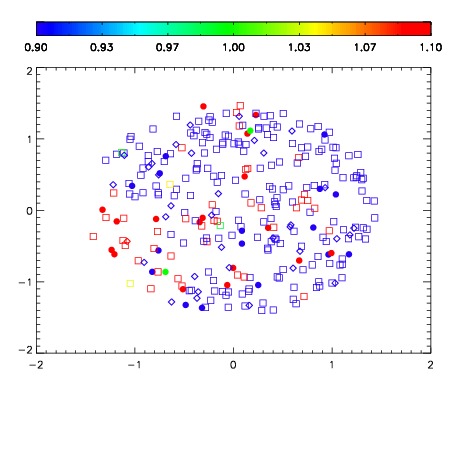
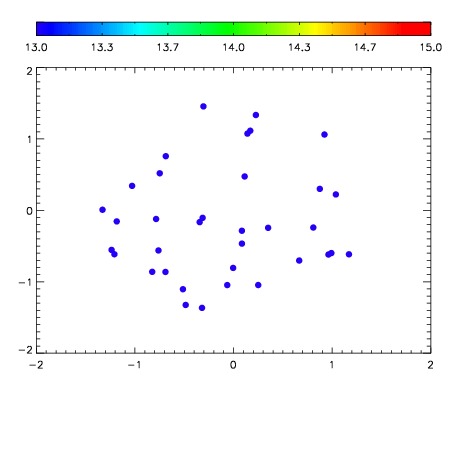

| Frame | Nreads | Zeropoints | Mag plots | Spatial mag deviation | Spatial sky 16325A emission deviations (filled: sky, open: star) | Spatial sky continuum emission | Spatial sky telluric CO2 absorption deviations (filled: H < 10) | |||||||||||||||||||||||
| 0 | 0 |
|
|
|
|
|
|
| IPAIR | NAME | SHIFT | NEWSHIFT | S/N | NAME | SHIFT | NEWSHIFT | S/N |
| 0 | 08780057 | 0.475676 | 0.00000 | 19.0048 | 08780052 | 0.00000 | 0.475676 | 18.9976 |
| 1 | 08780053 | 0.472920 | 0.00275600 | 19.0277 | 08780059 | -0.000808663 | 0.476485 | 19.0443 |
| 2 | 08780054 | 0.473568 | 0.00210801 | 19.0257 | 08780055 | 0.00145091 | 0.474225 | 19.0195 |
| 3 | 08780058 | 0.474428 | 0.00124800 | 19.0067 | 08780056 | 0.000635549 | 0.475040 | 19.0187 |