| Red | Green | Blue | |
| z | 17.64 | ||
| znorm | Inf | ||
| sky | -Inf | -Inf | -Inf |
| S/N | 17.2 | 29.0 | 29.4 |
| S/N(c) | 0.0 | 0.0 | 0.0 |
| SN(E/C) |
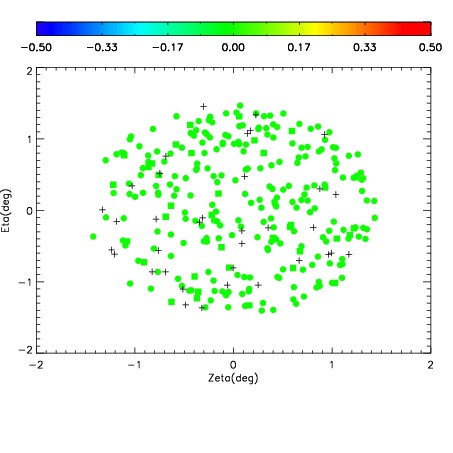
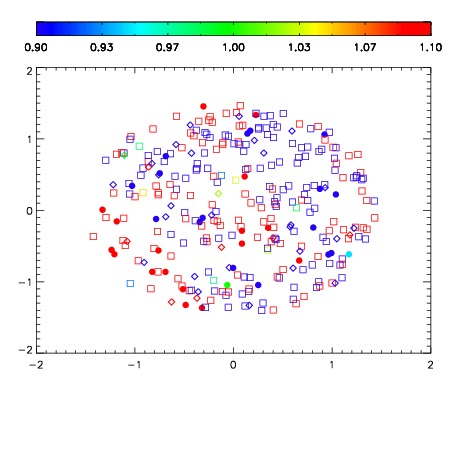
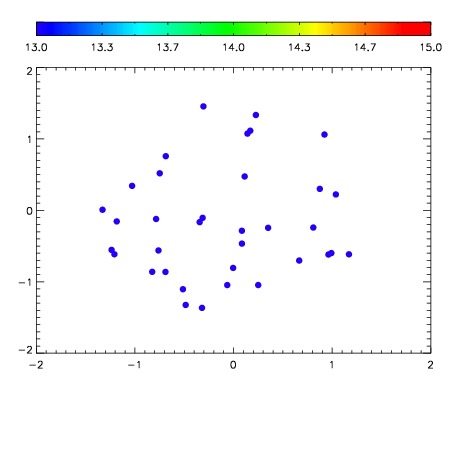

| Frame | Nreads | Zeropoints | Mag plots | Spatial mag deviation | Spatial sky 16325A emission deviations (filled: sky, open: star) | Spatial sky continuum emission | Spatial sky telluric CO2 absorption deviations (filled: H < 10) | |||||||||||||||||||||||
| 0 | 0 |
|
|
|
|
|
|
| IPAIR | NAME | SHIFT | NEWSHIFT | S/N | NAME | SHIFT | NEWSHIFT | S/N |
| 0 | 08870012 | 0.487706 | 0.00000 | 18.4825 | 08870013 | -0.00138389 | 0.489090 | 18.6920 |
| 1 | 08870011 | 0.487645 | 6.10054e-05 | 18.6993 | 08870010 | 0.00000 | 0.487706 | 18.9119 |
| 2 | 08870015 | 0.487649 | 5.70118e-05 | 17.7310 | 08870014 | -0.00148939 | 0.489195 | 18.2164 |
| 3 | 08870016 | 0.487515 | 0.000191003 | 17.3439 | 08870017 | -0.00142761 | 0.489134 | 17.5342 |