| Red | Green | Blue | |
| z | 17.64 | ||
| znorm | Inf | ||
| sky | -Inf | -Inf | -Inf |
| S/N | 28.0 | 45.9 | 47.8 |
| S/N(c) | 0.0 | 0.0 | 0.0 |
| SN(E/C) |
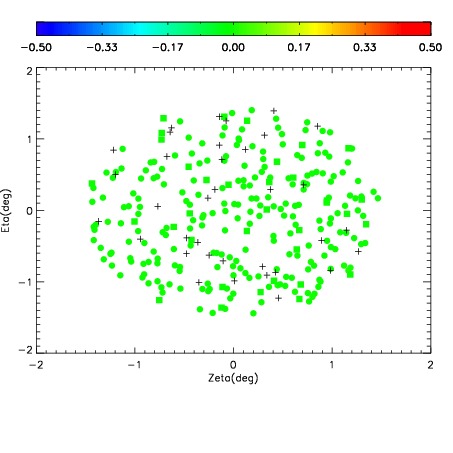
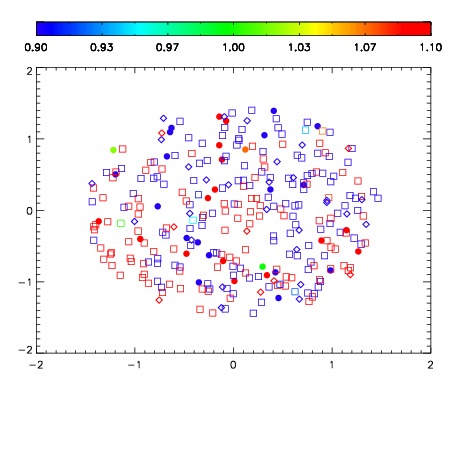
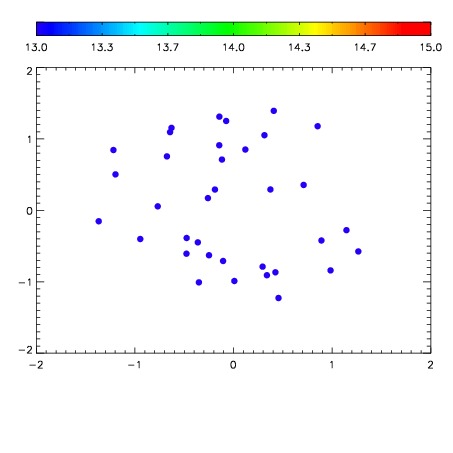

| Frame | Nreads | Zeropoints | Mag plots | Spatial mag deviation | Spatial sky 16325A emission deviations (filled: sky, open: star) | Spatial sky continuum emission | Spatial sky telluric CO2 absorption deviations (filled: H < 10) | |||||||||||||||||||||||
| 0 | 0 |
|
|
|
|
|
|
| IPAIR | NAME | SHIFT | NEWSHIFT | S/N | NAME | SHIFT | NEWSHIFT | S/N |
| 0 | 06680012 | 0.488245 | 0.00000 | 19.0735 | 06680013 | 0.00361499 | 0.484630 | 19.0566 |
| 1 | 06680016 | 0.487738 | 0.000506997 | 19.1326 | 06680017 | 0.00402414 | 0.484221 | 19.1276 |
| 2 | 06680015 | 0.488051 | 0.000194013 | 19.1158 | 06680014 | 0.00300181 | 0.485243 | 19.0848 |
| 3 | 06680011 | 0.487872 | 0.000373006 | 19.0491 | 06680010 | 0.00000 | 0.488245 | 18.9929 |