| Red | Green | Blue | |
| z | 17.64 | ||
| znorm | Inf | ||
| sky | -Inf | -Inf | -Inf |
| S/N | 28.2 | 46.5 | 47.0 |
| S/N(c) | 0.0 | 0.0 | 0.0 |
| SN(E/C) |
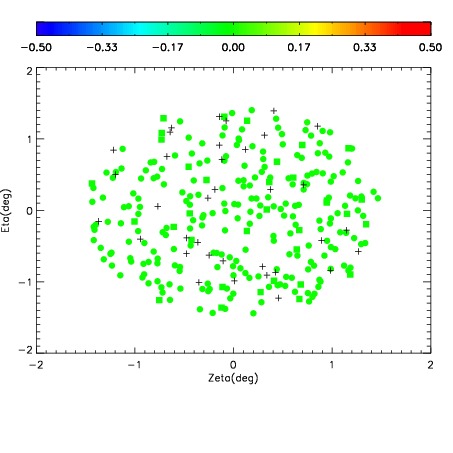
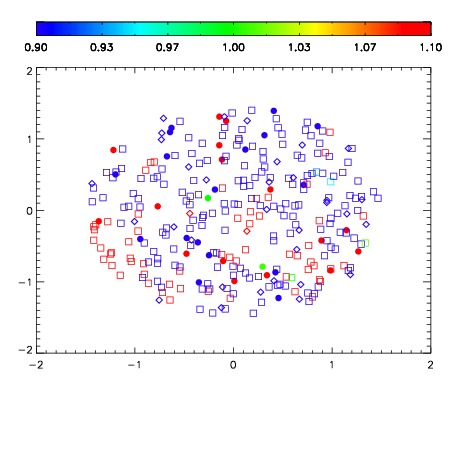
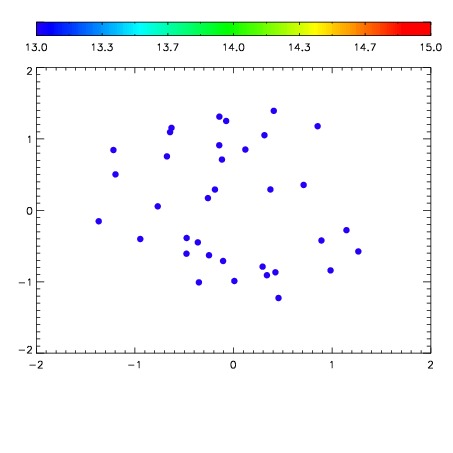

| Frame | Nreads | Zeropoints | Mag plots | Spatial mag deviation | Spatial sky 16325A emission deviations (filled: sky, open: star) | Spatial sky continuum emission | Spatial sky telluric CO2 absorption deviations (filled: H < 10) | |||||||||||||||||||||||
| 0 | 0 |
|
|
|
|
|
|
| IPAIR | NAME | SHIFT | NEWSHIFT | S/N | NAME | SHIFT | NEWSHIFT | S/N |
| 0 | 09070060 | 0.478281 | 0.00000 | 19.1100 | 09070061 | -0.000276577 | 0.478558 | 19.1073 |
| 1 | 09070059 | 0.477322 | 0.000958979 | 19.0983 | 09070065 | 0.00103866 | 0.477242 | 19.1024 |
| 2 | 09070064 | 0.477178 | 0.00110298 | 19.0885 | 09070058 | 0.00000 | 0.478281 | 19.1002 |
| 3 | 09070063 | 0.478208 | 7.29859e-05 | 19.0845 | 09070062 | 0.000364876 | 0.477916 | 19.0868 |