| Red | Green | Blue | |
| z | 17.64 | ||
| znorm | Inf | ||
| sky | -NaN | -NaN | -Inf |
| S/N | 25.8 | 43.2 | 44.0 |
| S/N(c) | 0.0 | 0.0 | 0.0 |
| SN(E/C) |
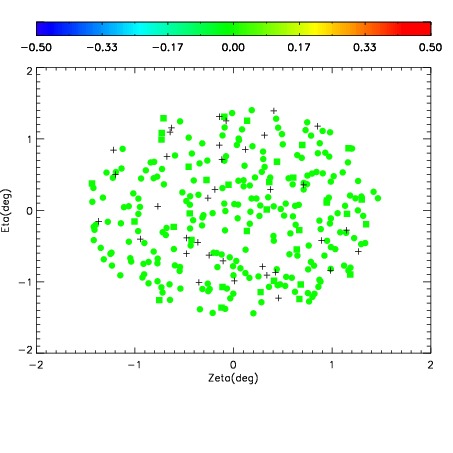
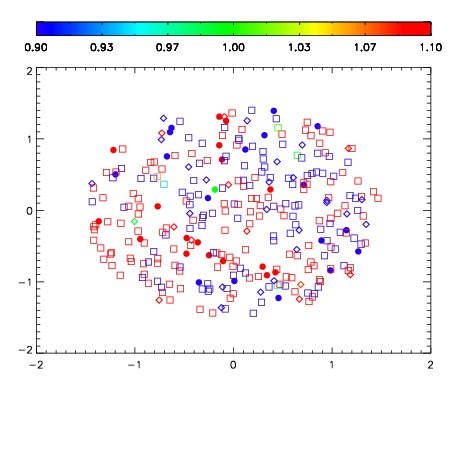


| Frame | Nreads | Zeropoints | Mag plots | Spatial mag deviation | Spatial sky 16325A emission deviations (filled: sky, open: star) | Spatial sky continuum emission | Spatial sky telluric CO2 absorption deviations (filled: H < 10) | |||||||||||||||||||||||
| 0 | 0 |
|
|
|
|
|
|
| IPAIR | NAME | SHIFT | NEWSHIFT | S/N | NAME | SHIFT | NEWSHIFT | S/N |
| 0 | 10040013 | 0.472956 | 0.00000 | 19.0257 | 10040015 | 0.00125716 | 0.471699 | 19.0096 |
| 1 | 10040016 | 0.471527 | 0.00142899 | 19.0696 | 10040018 | 0.000467391 | 0.472489 | 19.0828 |
| 2 | 10040017 | 0.472508 | 0.000447989 | 19.0693 | 10040014 | 0.000790604 | 0.472165 | 19.0175 |
| 3 | 10040012 | 0.472574 | 0.000382006 | 18.9160 | 10040011 | 0.00000 | 0.472956 | 18.9788 |