| Red | Green | Blue | |
| z | 17.64 | ||
| znorm | Inf | ||
| sky | -Inf | -Inf | -Inf |
| S/N | 27.9 | 46.0 | 48.9 |
| S/N(c) | 0.0 | 0.0 | 0.0 |
| SN(E/C) |
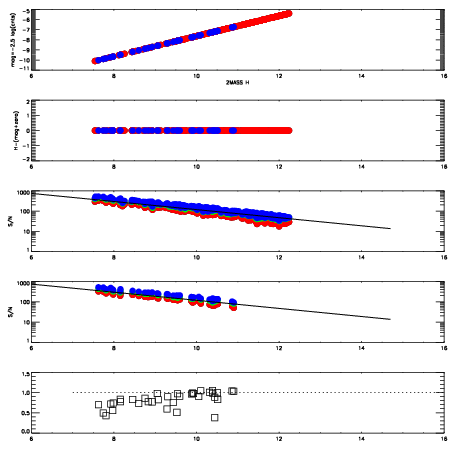
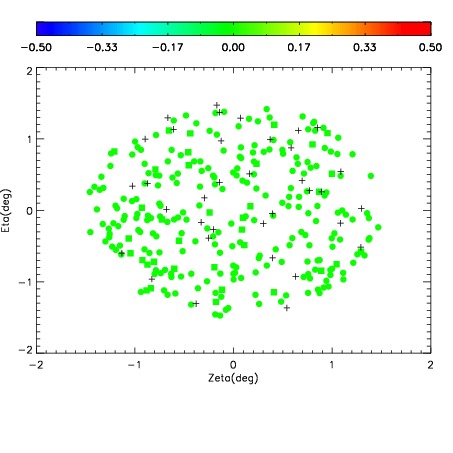
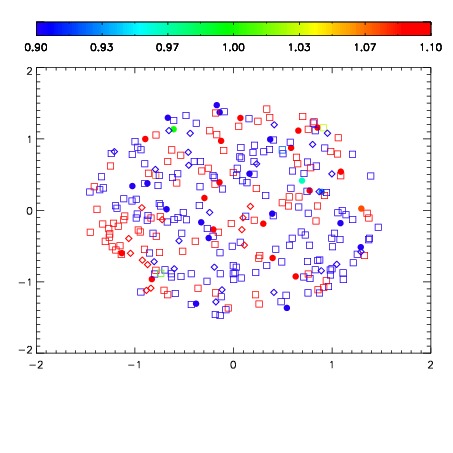


| Frame | Nreads | Zeropoints | Mag plots | Spatial mag deviation | Spatial sky 16325A emission deviations (filled: sky, open: star) | Spatial sky continuum emission | Spatial sky telluric CO2 absorption deviations (filled: H < 10) | |||||||||||||||||||||||
| 0 | 0 |
|
|
|
|
|
|
| IPAIR | NAME | SHIFT | NEWSHIFT | S/N | NAME | SHIFT | NEWSHIFT | S/N |
| 0 | 06670013 | 0.476646 | 0.00000 | 19.0659 | 06670011 | 0.00000 | 0.476646 | 19.0695 |
| 1 | 06670016 | 0.475409 | 0.00123700 | 19.1058 | 06670014 | 0.00159290 | 0.475053 | 19.1281 |
| 2 | 06670012 | 0.476185 | 0.000461012 | 19.0911 | 06670015 | -0.000454140 | 0.477100 | 19.1044 |
| 3 | 06670017 | 0.476370 | 0.000275999 | 19.0199 | 06670018 | 0.00541706 | 0.471229 | 19.0263 |