| Red | Green | Blue | |
| z | 17.64 | ||
| znorm | Inf | ||
| sky | -Inf | -Inf | -Inf |
| S/N | 27.8 | 46.0 | 48.6 |
| S/N(c) | 0.0 | 0.0 | 0.0 |
| SN(E/C) |
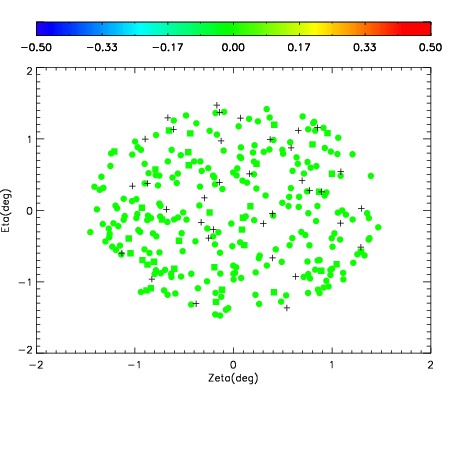
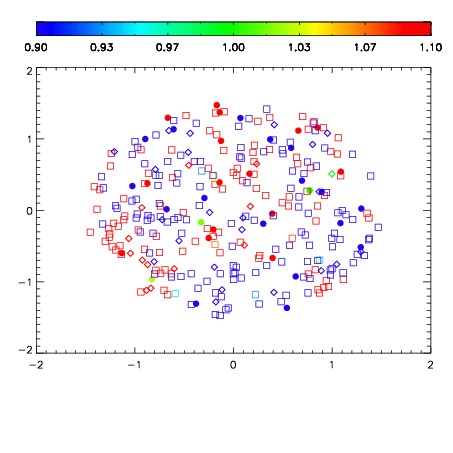
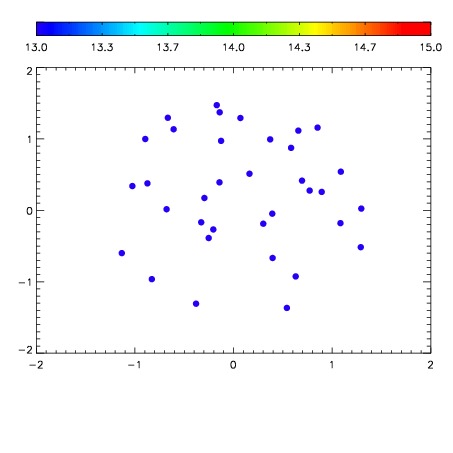

| Frame | Nreads | Zeropoints | Mag plots | Spatial mag deviation | Spatial sky 16325A emission deviations (filled: sky, open: star) | Spatial sky continuum emission | Spatial sky telluric CO2 absorption deviations (filled: H < 10) | |||||||||||||||||||||||
| 0 | 0 |
|
|
|
|
|
|
| IPAIR | NAME | SHIFT | NEWSHIFT | S/N | NAME | SHIFT | NEWSHIFT | S/N |
| 0 | 10100014 | 0.473115 | 0.00000 | 18.9602 | 10100015 | 0.00294720 | 0.470168 | 19.0098 |
| 1 | 10100018 | 0.473095 | 1.99974e-05 | 19.1227 | 10100019 | 0.00407335 | 0.469042 | 19.1183 |
| 2 | 10100013 | 0.472394 | 0.000721008 | 19.1133 | 10100012 | 0.00000 | 0.473115 | 19.0785 |
| 3 | 10100017 | 0.472668 | 0.000447005 | 19.0717 | 10100016 | 0.00314693 | 0.469968 | 19.0300 |