| Red | Green | Blue | |
| z | 17.64 | ||
| znorm | Inf | ||
| sky | -Inf | -Inf | -Inf |
| S/N | 28.3 | 47.3 | 50.2 |
| S/N(c) | 0.0 | 0.0 | 0.0 |
| SN(E/C) |

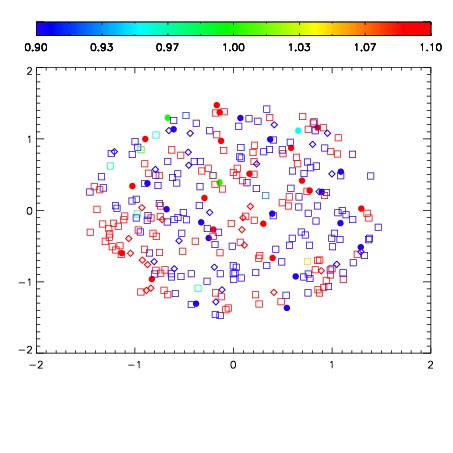


| Frame | Nreads | Zeropoints | Mag plots | Spatial mag deviation | Spatial sky 16325A emission deviations (filled: sky, open: star) | Spatial sky continuum emission | Spatial sky telluric CO2 absorption deviations (filled: H < 10) | |||||||||||||||||||||||
| 0 | 0 |
|
|
|
|
|
|
| IPAIR | NAME | SHIFT | NEWSHIFT | S/N | NAME | SHIFT | NEWSHIFT | S/N |
| 0 | 10160019 | 0.503478 | 0.00000 | 19.1432 | 10160020 | 0.00329587 | 0.500182 | 19.1326 |
| 1 | 10160018 | 0.503114 | 0.000364006 | 19.1966 | 10160017 | 0.00235211 | 0.501126 | 19.1494 |
| 2 | 10160015 | 0.502190 | 0.00128800 | 19.0118 | 10160016 | 0.00156334 | 0.501915 | 19.1268 |
| 3 | 10160014 | 0.501798 | 0.00168002 | 18.9506 | 10160013 | 0.00000 | 0.503478 | 18.9860 |