| Red | Green | Blue | |
| z | 17.64 | ||
| znorm | Inf | ||
| sky | -Inf | -Inf | -Inf |
| S/N | 33.0 | 55.9 | 58.7 |
| S/N(c) | 0.0 | 0.0 | 0.0 |
| SN(E/C) |
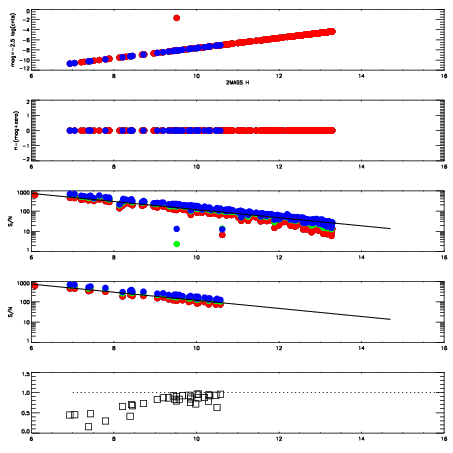
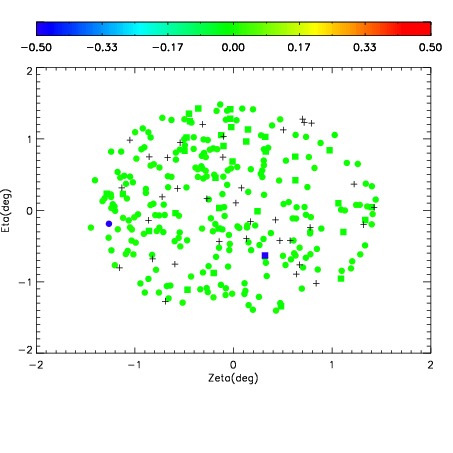
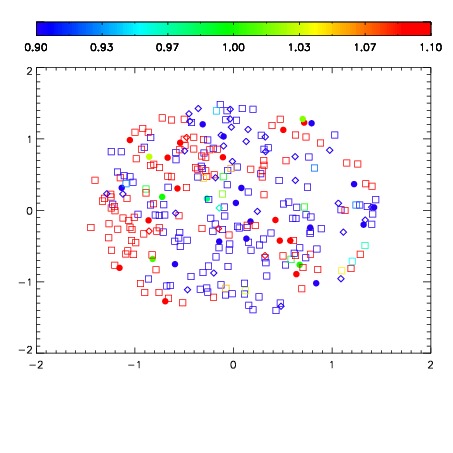
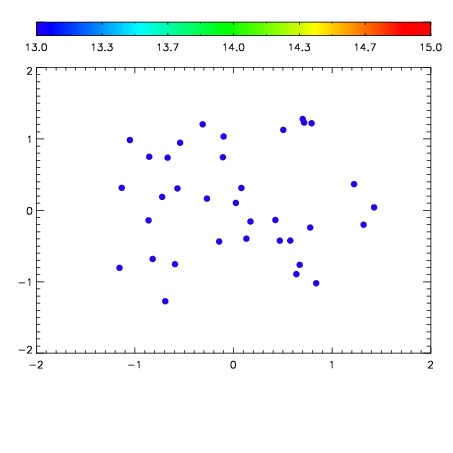

| Frame | Nreads | Zeropoints | Mag plots | Spatial mag deviation | Spatial sky 16325A emission deviations (filled: sky, open: star) | Spatial sky continuum emission | Spatial sky telluric CO2 absorption deviations (filled: H < 10) | |||||||||||||||||||||||
| 0 | 0 |
|
|
|
|
|
|
| IPAIR | NAME | SHIFT | NEWSHIFT | S/N | NAME | SHIFT | NEWSHIFT | S/N |
| 0 | 06680038 | 0.485451 | 0.00000 | 19.1532 | 06680036 | 0.00231001 | 0.483141 | 19.1858 |
| 1 | 06680034 | 0.483250 | 0.00220102 | 19.2108 | 06680035 | 0.00167421 | 0.483777 | 19.2078 |
| 2 | 06680033 | 0.482683 | 0.00276801 | 19.2048 | 06680032 | 0.00000 | 0.485451 | 19.1943 |
| 3 | 06680037 | 0.484160 | 0.00129101 | 19.1506 | 06680039 | 0.000650616 | 0.484800 | 19.1359 |