| Red | Green | Blue | |
| z | 17.64 | ||
| znorm | Inf | ||
| sky | -Inf | -NaN | -Inf |
| S/N | 33.7 | 54.5 | 58.1 |
| S/N(c) | 0.0 | 0.0 | 0.0 |
| SN(E/C) |
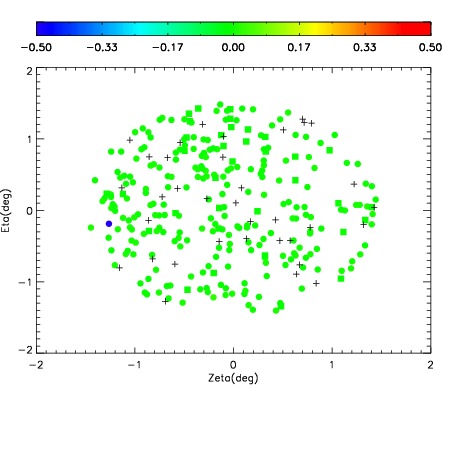


| Frame | Nreads | Zeropoints | Mag plots | Spatial mag deviation | Spatial sky 16325A emission deviations (filled: sky, open: star) | Spatial sky continuum emission | Spatial sky telluric CO2 absorption deviations (filled: H < 10) | |||||||||||||||||||||||
| 0 | 0 |
|
|
|
|
|
|
| IPAIR | NAME | SHIFT | NEWSHIFT | S/N | NAME | SHIFT | NEWSHIFT | S/N |
| 0 | 06990012 | 0.484937 | 0.00000 | 19.2288 | 06990014 | 0.00183074 | 0.483106 | 19.2340 |
| 1 | 06990016 | 0.484341 | 0.000596017 | 19.2357 | 06990017 | 0.00212448 | 0.482813 | 19.2521 |
| 2 | 06990015 | 0.480686 | 0.00425100 | 19.2276 | 06990013 | 0.00121383 | 0.483723 | 19.2229 |
| 3 | 06990011 | 0.482400 | 0.00253701 | 19.1953 | 06990010 | 0.00000 | 0.484937 | 19.1913 |