| Red | Green | Blue | |
| z | 17.63 | ||
| znorm | Inf | ||
| sky | -NaN | -NaN | -NaN |
| S/N | 14.9 | 28.7 | 29.0 |
| S/N(c) | 0.0 | 0.0 | 0.0 |
| SN(E/C) |
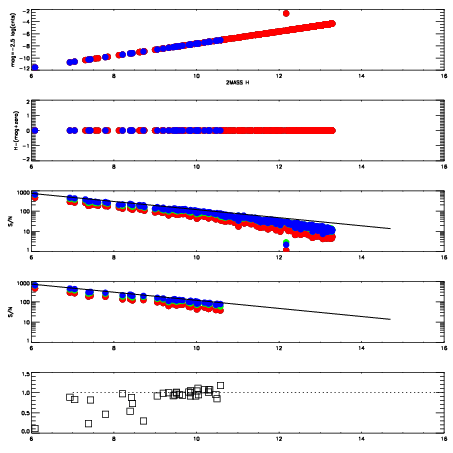

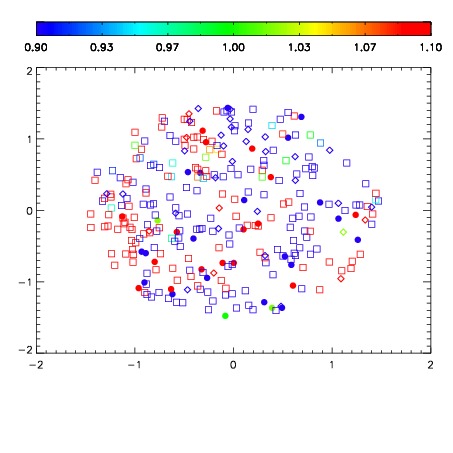


| Frame | Nreads | Zeropoints | Mag plots | Spatial mag deviation | Spatial sky 16325A emission deviations (filled: sky, open: star) | Spatial sky continuum emission | Spatial sky telluric CO2 absorption deviations (filled: H < 10) | |||||||||||||||||||||||
| 0 | 0 |
|
|
|
|
|
|
| IPAIR | NAME | SHIFT | NEWSHIFT | S/N | NAME | SHIFT | NEWSHIFT | S/N |
| 0 | 10370028 | 0.517239 | 0.00000 | 18.0957 | 10370030 | 0.000258917 | 0.516980 | 18.1581 |
| 1 | 10370031 | 0.516562 | 0.000676990 | 18.1880 | 10370029 | 0.000349226 | 0.516890 | 18.2557 |
| 2 | 10370032 | 0.517022 | 0.000216961 | 17.9422 | 10370033 | 0.00162364 | 0.515615 | 18.0274 |
| 3 | 10370027 | 0.517141 | 9.79900e-05 | 17.8953 | 10370026 | 0.00000 | 0.517239 | 17.9392 |