| Red | Green | Blue | |
| z | 17.63 | ||
| znorm | Inf | ||
| sky | -NaN | -NaN | -NaN |
| S/N | 29.4 | 49.9 | 52.4 |
| S/N(c) | 0.0 | 0.0 | 0.0 |
| SN(E/C) |
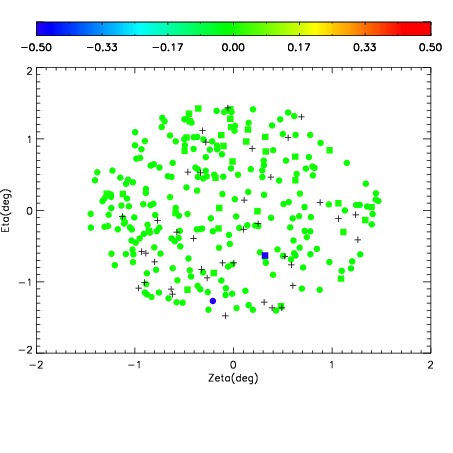
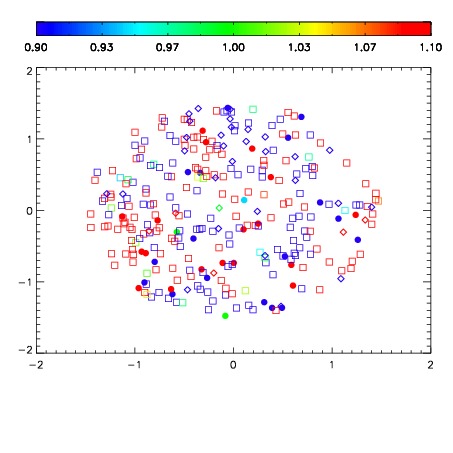


| Frame | Nreads | Zeropoints | Mag plots | Spatial mag deviation | Spatial sky 16325A emission deviations (filled: sky, open: star) | Spatial sky continuum emission | Spatial sky telluric CO2 absorption deviations (filled: H < 10) | |||||||||||||||||||||||
| 0 | 0 |
|
|
|
|
|
|
| IPAIR | NAME | SHIFT | NEWSHIFT | S/N | NAME | SHIFT | NEWSHIFT | S/N |
| 0 | 10410028 | 0.514648 | 0.00000 | 19.0429 | 10410026 | 0.00162846 | 0.513020 | 19.0595 |
| 1 | 10410027 | 0.514154 | 0.000494003 | 19.0762 | 10410029 | 0.00371183 | 0.510936 | 19.0943 |
| 2 | 10410024 | 0.514642 | 6.02007e-06 | 19.0409 | 10410025 | 0.00144983 | 0.513198 | 19.0228 |
| 3 | 10410023 | 0.514581 | 6.69956e-05 | 19.0311 | 10410022 | 0.00000 | 0.514648 | 18.9603 |