| Red | Green | Blue | |
| z | 17.64 | ||
| znorm | Inf | ||
| sky | -Inf | -Inf | -Inf |
| S/N | 27.2 | 45.4 | 47.2 |
| S/N(c) | 0.0 | 0.0 | 0.0 |
| SN(E/C) |


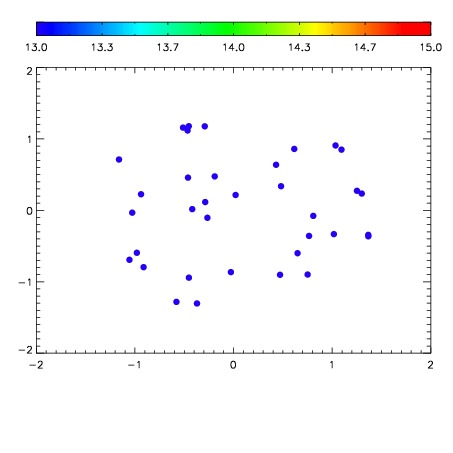

| Frame | Nreads | Zeropoints | Mag plots | Spatial mag deviation | Spatial sky 16325A emission deviations (filled: sky, open: star) | Spatial sky continuum emission | Spatial sky telluric CO2 absorption deviations (filled: H < 10) | |||||||||||||||||||||||
| 0 | 0 |
|
|
|
|
|
|
| IPAIR | NAME | SHIFT | NEWSHIFT | S/N | NAME | SHIFT | NEWSHIFT | S/N |
| 0 | 10200039 | 0.499959 | 0.00000 | 19.0940 | 10200044 | 0.00197226 | 0.497987 | 19.0773 |
| 1 | 10200038 | 0.499725 | 0.000233978 | 19.0965 | 10200037 | 0.00000 | 0.499959 | 19.1460 |
| 2 | 10200043 | 0.494037 | 0.00592199 | 19.0536 | 10200041 | 0.00149493 | 0.498464 | 19.0609 |
| 3 | 10200042 | 0.494183 | 0.00577599 | 19.0439 | 10200040 | 0.00246155 | 0.497497 | 19.0153 |