| Red | Green | Blue | |
| z | 17.64 | ||
| znorm | Inf | ||
| sky | -NaN | -NaN | -Inf |
| S/N | 28.1 | 46.6 | 49.0 |
| S/N(c) | 0.0 | 0.0 | 0.0 |
| SN(E/C) |
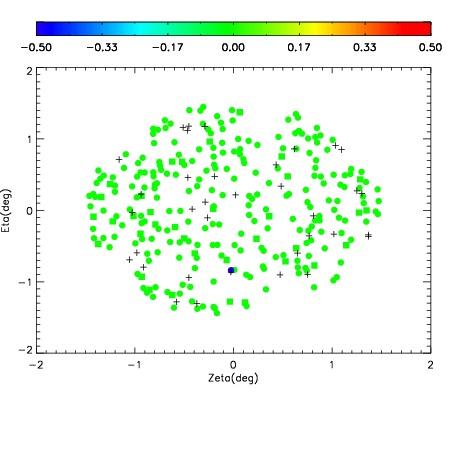

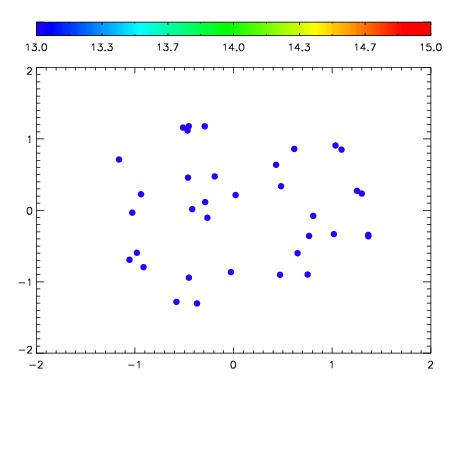

| Frame | Nreads | Zeropoints | Mag plots | Spatial mag deviation | Spatial sky 16325A emission deviations (filled: sky, open: star) | Spatial sky continuum emission | Spatial sky telluric CO2 absorption deviations (filled: H < 10) | |||||||||||||||||||||||
| 0 | 0 |
|
|
|
|
|
|
| IPAIR | NAME | SHIFT | NEWSHIFT | S/N | NAME | SHIFT | NEWSHIFT | S/N |
| 0 | 10260031 | 0.494550 | 0.00000 | 19.0894 | 10260032 | 0.00642321 | 0.488127 | 19.0893 |
| 1 | 10260027 | 0.493403 | 0.00114700 | 19.1785 | 10260025 | 0.00000 | 0.494550 | 19.1741 |
| 2 | 10260030 | 0.493375 | 0.00117499 | 19.1357 | 10260028 | 0.00427006 | 0.490280 | 19.1619 |
| 3 | 10260026 | 0.493408 | 0.00114200 | 19.1342 | 10260029 | 0.00474852 | 0.489801 | 19.1022 |