| Red | Green | Blue | |
| z | 17.64 | ||
| znorm | Inf | ||
| sky | -Inf | -Inf | -Inf |
| S/N | 28.4 | 46.8 | 48.9 |
| S/N(c) | 0.0 | 0.0 | 0.0 |
| SN(E/C) |
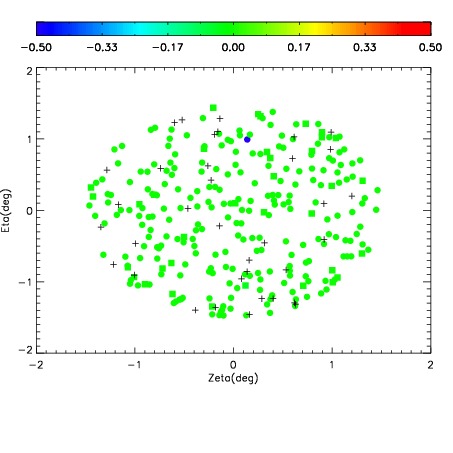
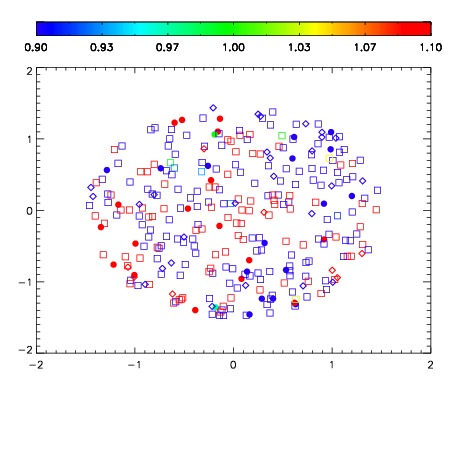


| Frame | Nreads | Zeropoints | Mag plots | Spatial mag deviation | Spatial sky 16325A emission deviations (filled: sky, open: star) | Spatial sky continuum emission | Spatial sky telluric CO2 absorption deviations (filled: H < 10) | |||||||||||||||||||||||
| 0 | 0 |
|
|
|
|
|
|
| IPAIR | NAME | SHIFT | NEWSHIFT | S/N | NAME | SHIFT | NEWSHIFT | S/N |
| 0 | 06660031 | 0.489392 | 0.00000 | 19.0148 | 06660025 | 0.00000 | 0.489392 | 18.9985 |
| 1 | 06660030 | 0.489265 | 0.000127017 | 19.0272 | 06660028 | 0.0104173 | 0.478975 | 19.0192 |
| 2 | 06660027 | 0.489298 | 9.40263e-05 | 18.9474 | 06660029 | 0.00294453 | 0.486447 | 18.9960 |
| 3 | 06660026 | 0.488936 | 0.000456005 | 18.8934 | 06660032 | 0.00992709 | 0.479465 | 18.9925 |