| Red | Green | Blue | |
| z | 17.64 | ||
| znorm | Inf | ||
| sky | -NaN | -NaN | -Inf |
| S/N | 29.8 | 49.4 | 52.8 |
| S/N(c) | 0.0 | 0.0 | 0.0 |
| SN(E/C) |


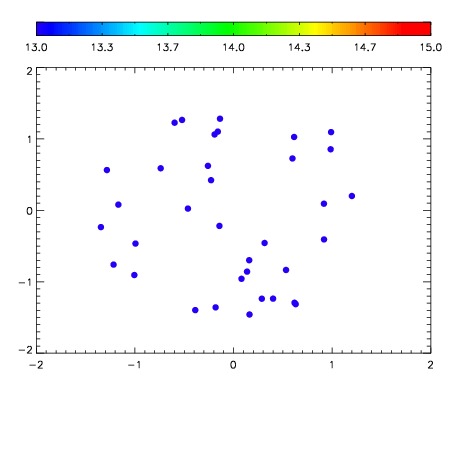

| Frame | Nreads | Zeropoints | Mag plots | Spatial mag deviation | Spatial sky 16325A emission deviations (filled: sky, open: star) | Spatial sky continuum emission | Spatial sky telluric CO2 absorption deviations (filled: H < 10) | |||||||||||||||||||||||
| 0 | 0 |
|
|
|
|
|
|
| IPAIR | NAME | SHIFT | NEWSHIFT | S/N | NAME | SHIFT | NEWSHIFT | S/N |
| 0 | 06970013 | 0.484407 | 0.00000 | 19.0684 | 06970011 | 0.00000 | 0.484407 | 19.0966 |
| 1 | 06970017 | 0.482346 | 0.00206101 | 19.1278 | 06970015 | -0.00300621 | 0.487413 | 19.1099 |
| 2 | 06970016 | 0.482562 | 0.00184500 | 19.1181 | 06970018 | -0.00221184 | 0.486619 | 19.1041 |
| 3 | 06970012 | 0.483727 | 0.000680000 | 19.0988 | 06970014 | -0.00250674 | 0.486914 | 19.1014 |